3. Exploring the Dashboard and Tower Interface
Note
Ansible Tower 2.2 provides a streamlined interface, with the setup button offering access to administrative configuration needs. Users of older versions of Ansible Tower (pre-2.2) can access most of these through the top-level navigational menu.

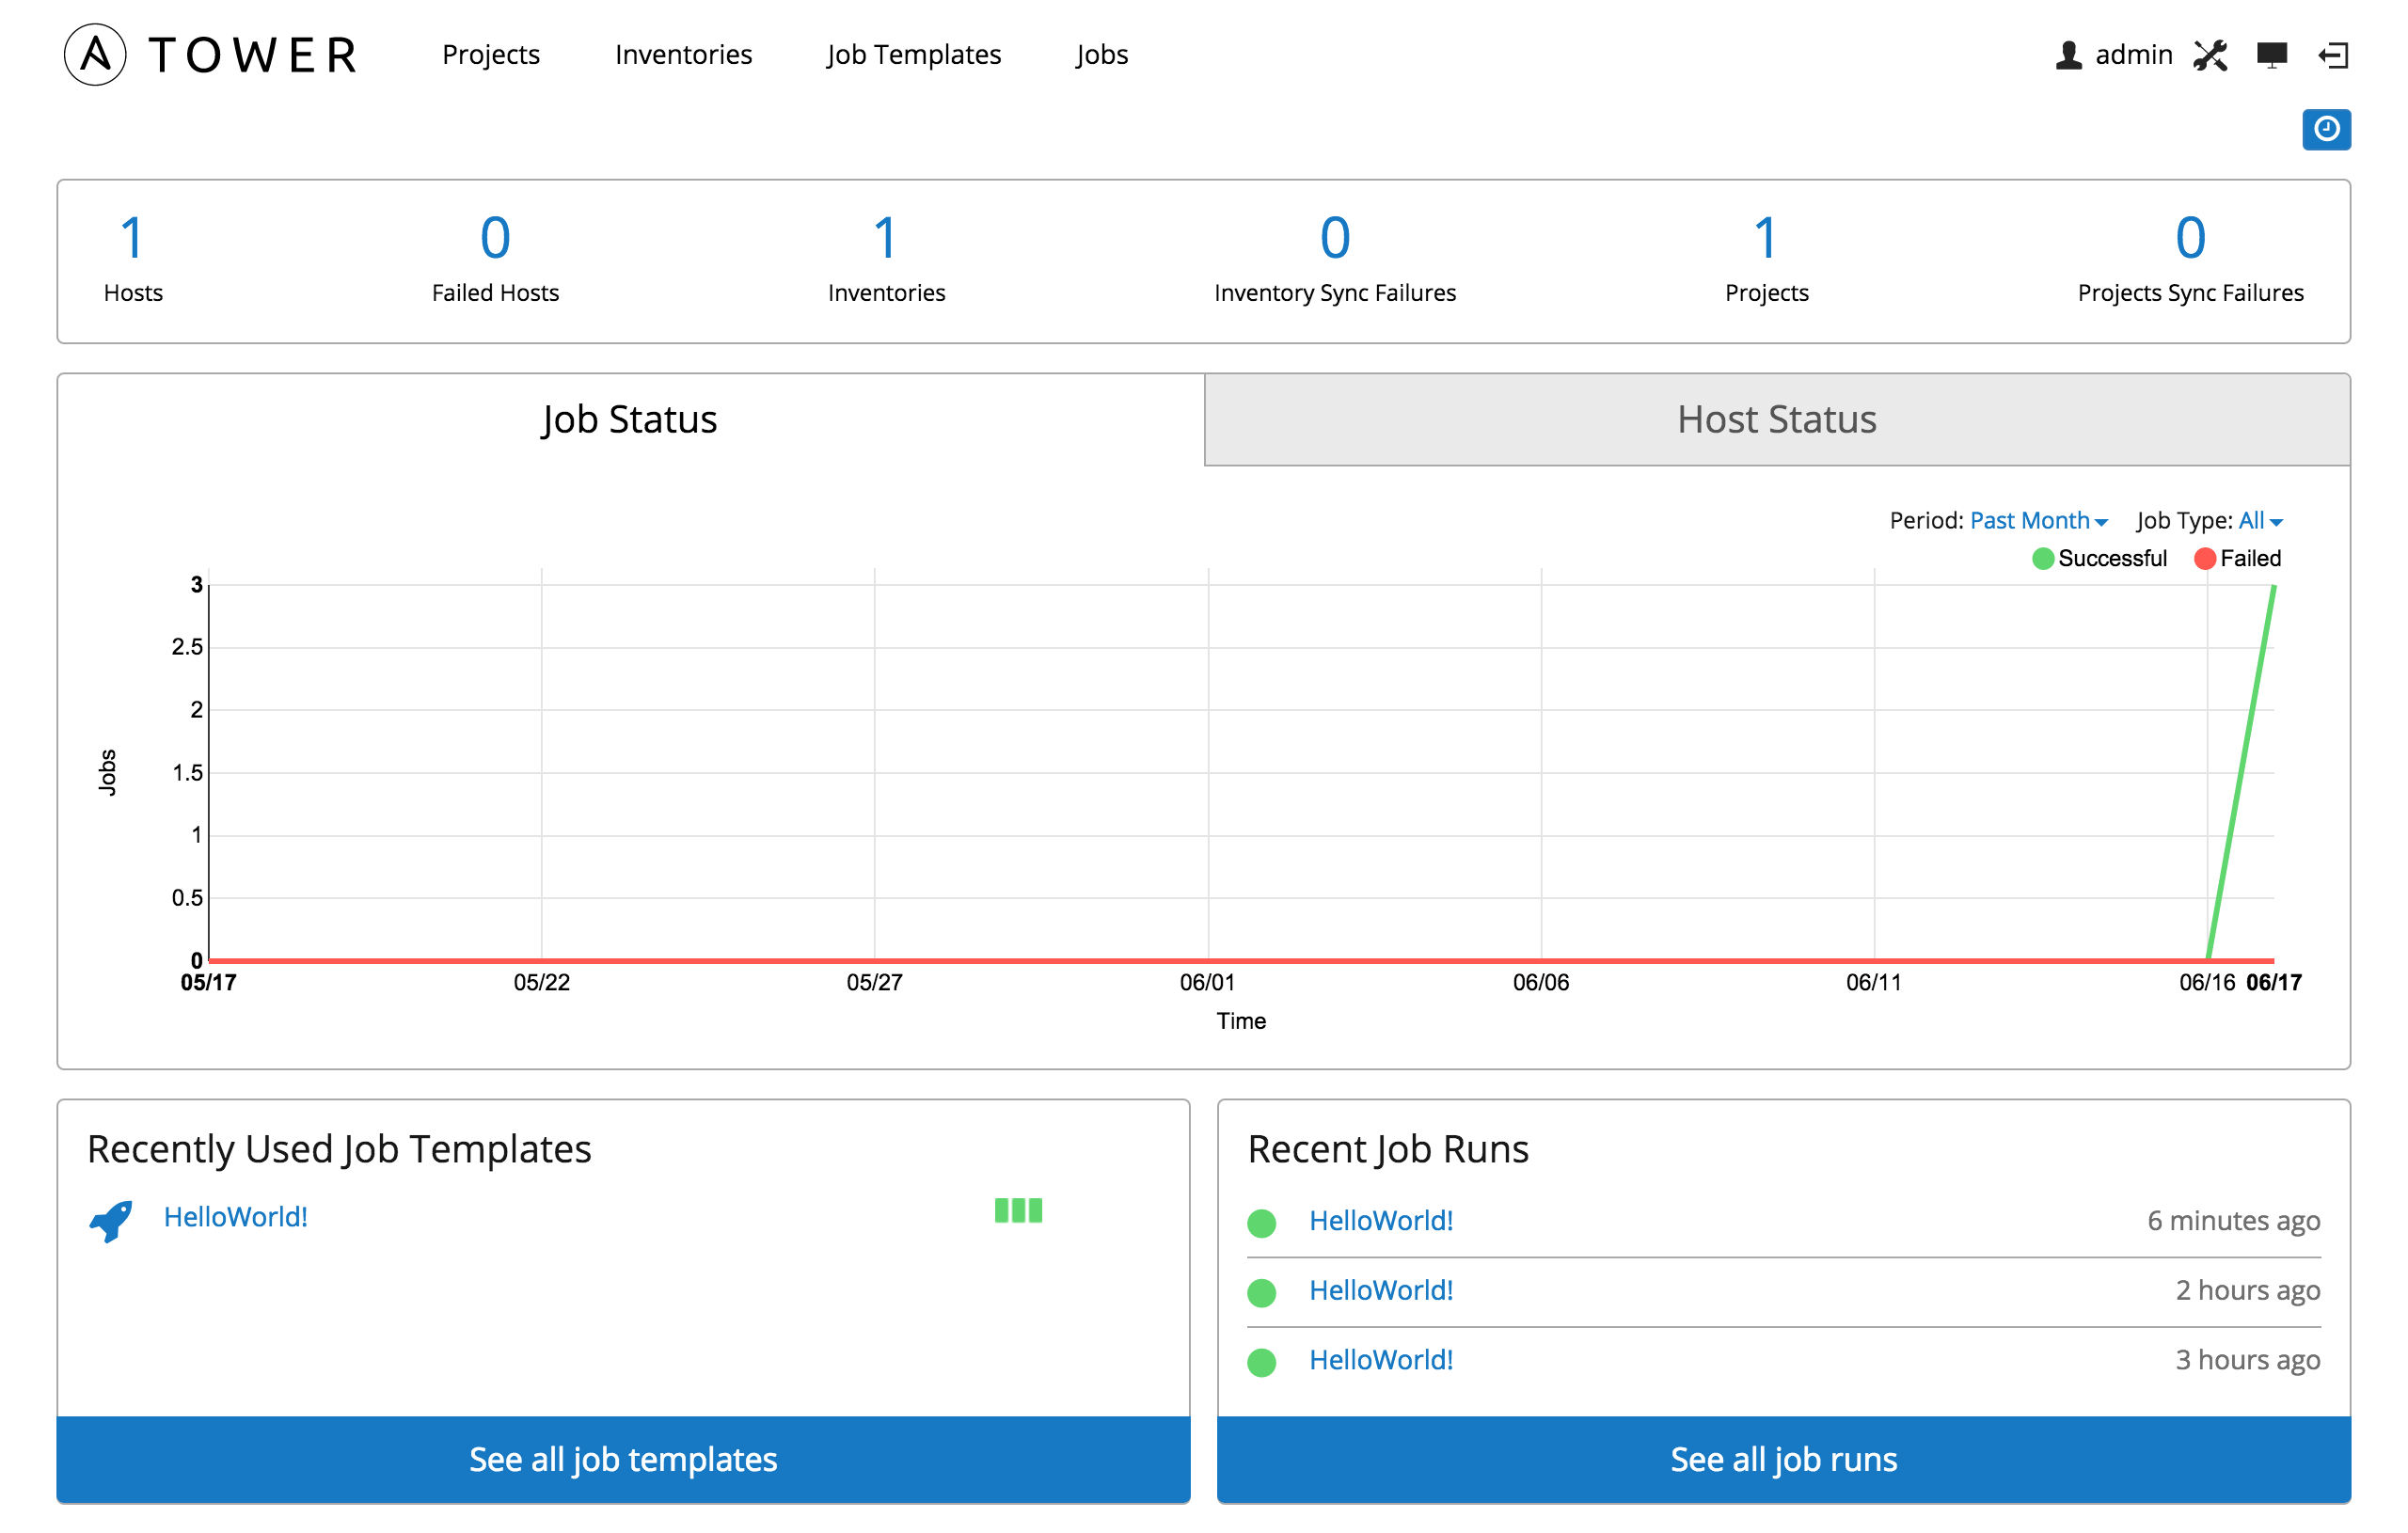
The Tower Dashboard offers a friendly graphical framework for your IT orchestration needs. Across the top-left side of the Tower Dashboard, administrators can quickly navigate to their Projects, Inventories, Job Templates, and Jobs.
Across the top-right side of this interface, administrators can access the tools they need to configure organizations, users, groups, permissions, and more.
On the main Tower Dashboard screen, a summary appears listing your current Hosts, Inventories, and Projects. You can view charts and graphs for Job Status and Host Status by clicking on their tabs. Also available for review are summaries of Recent Used Job Templates and Recent Run Jobs.
Note
Clicking on the Ansible Tower logo at any time returns you to the Dashboard.
3.3. Portal Mode
Portal mode, a single-page view of jobs and job templates, can be accessed by clicking the  button.
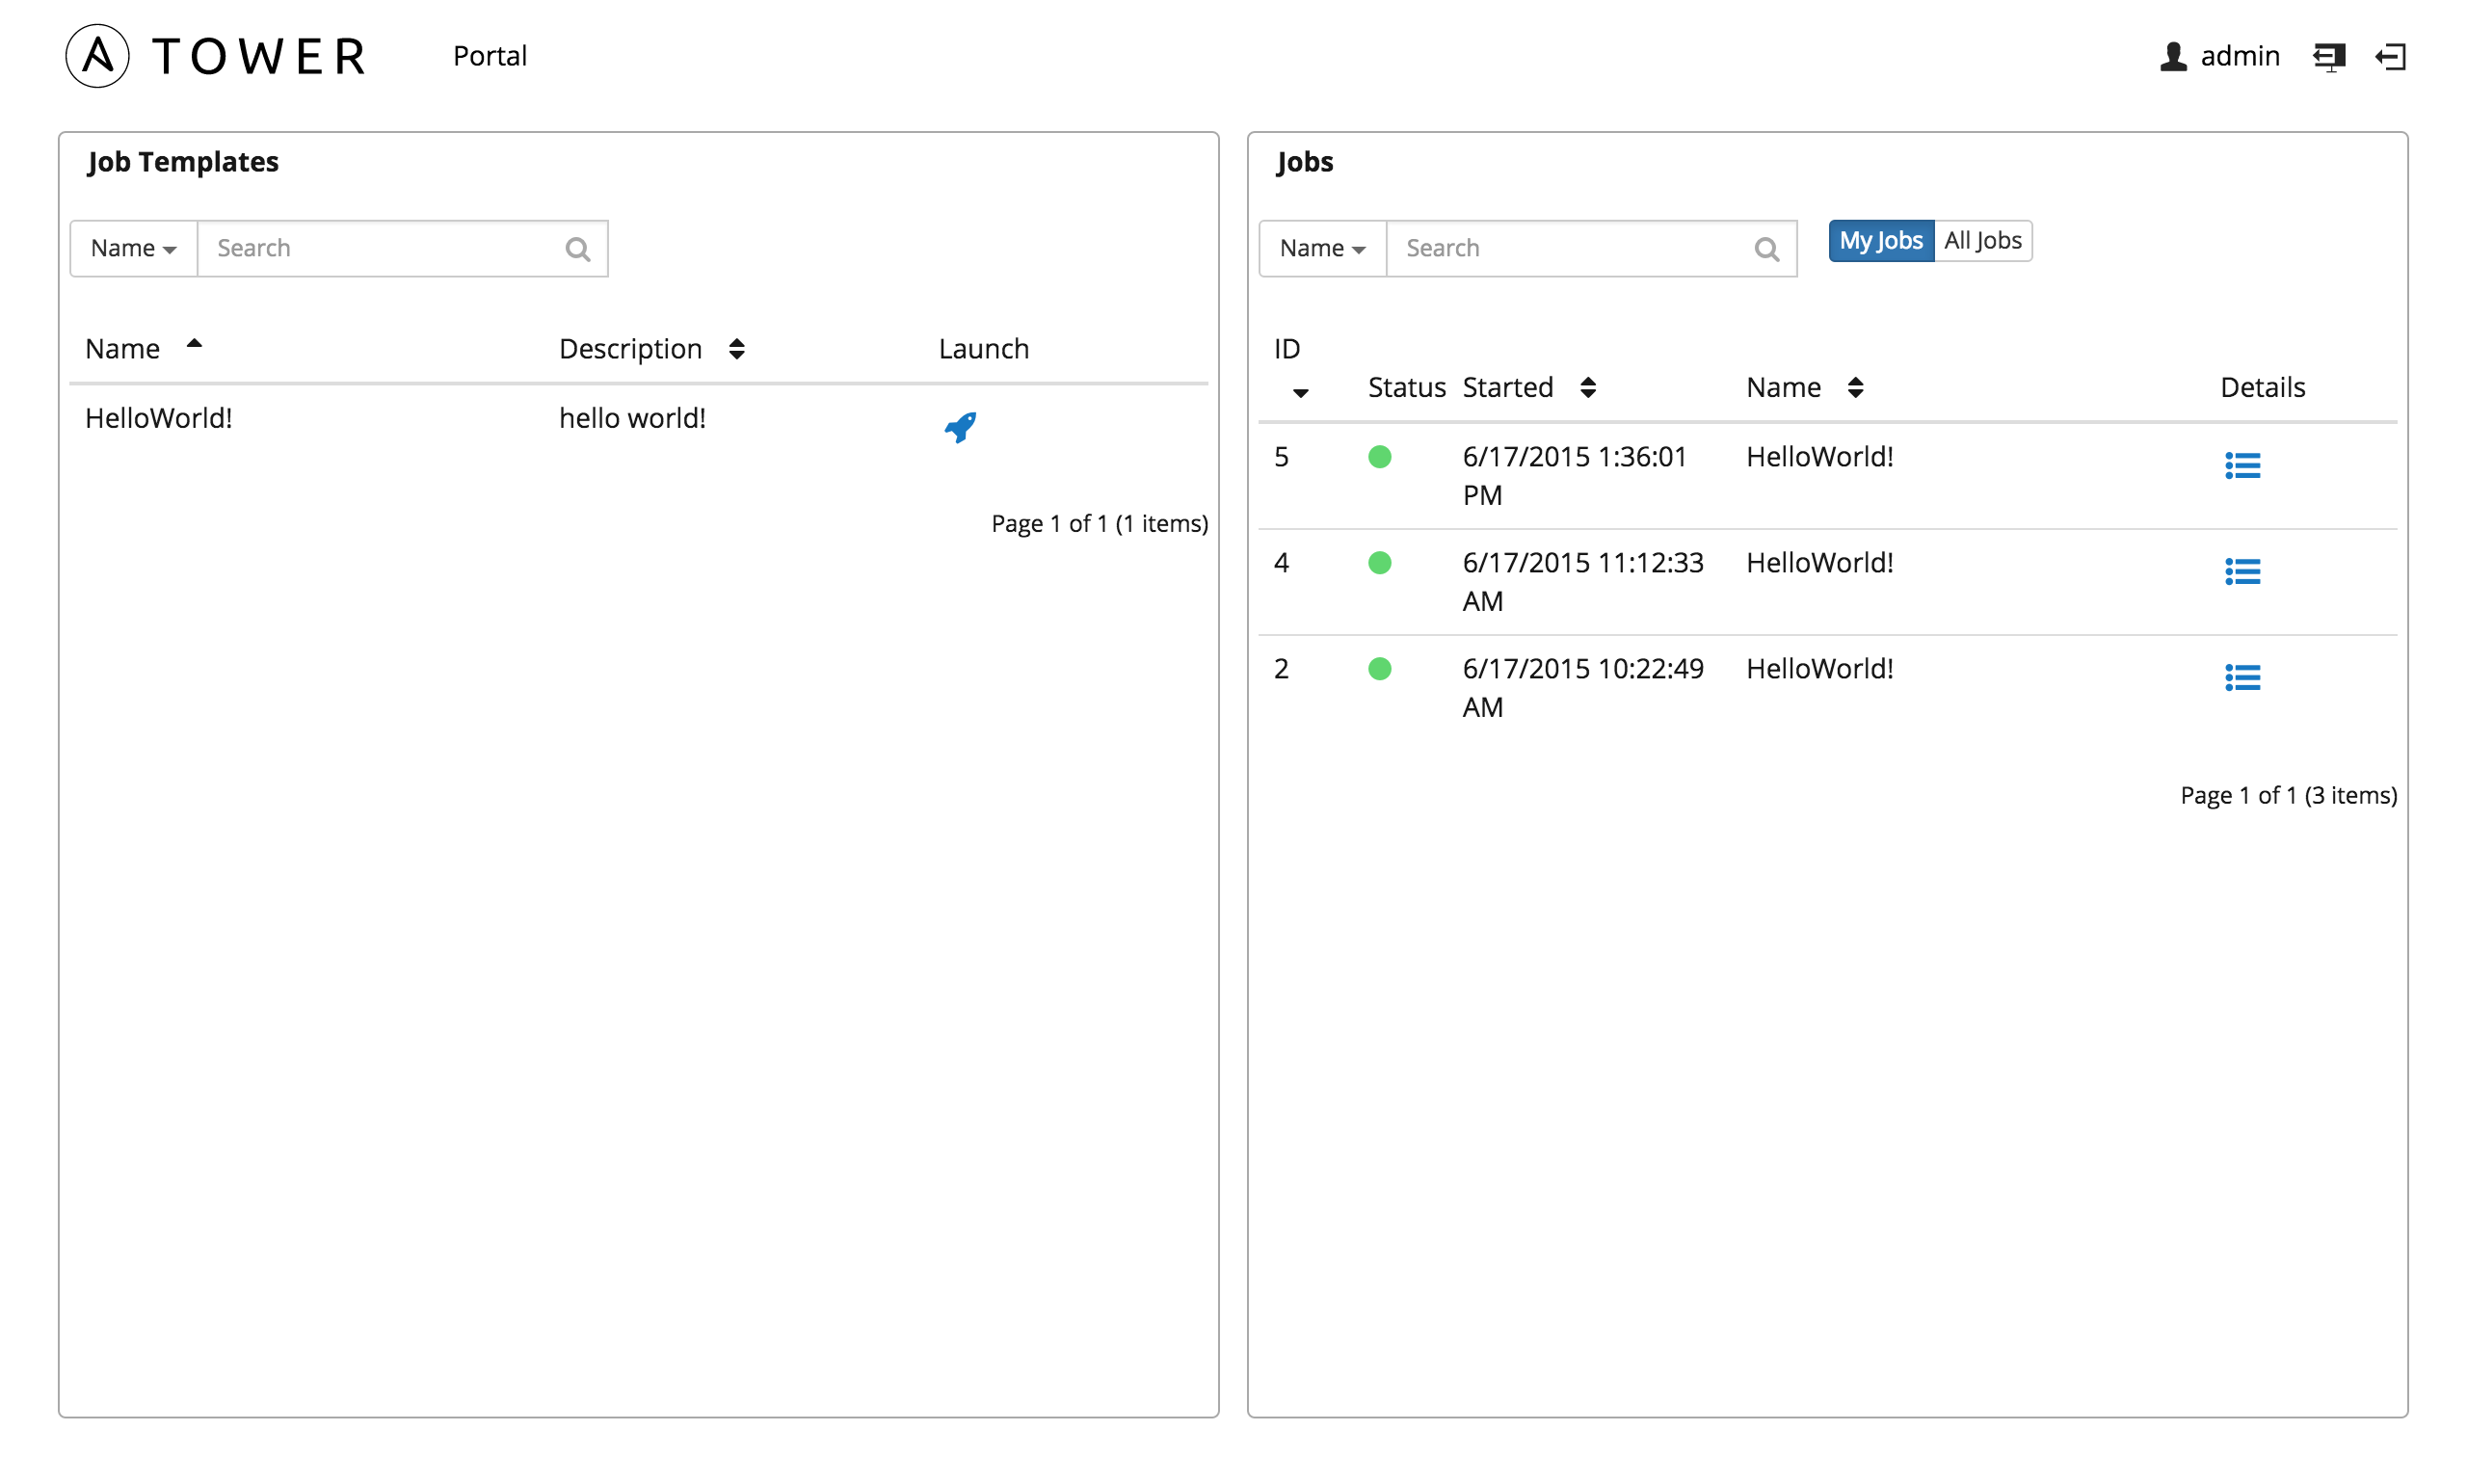
Portal mode is a simplified interface for users that need to run Ansible jobs, but that don’t need an advanced knowledge of Ansible or Tower. Portal mode could be used by, for instance, development teams, or even departmental users in non-technical fields.
Portal mode offers Tower users a simplified, clean interface to the jobs that they are able to run, and the results of jobs that they have run in the past.
Pressing the  button beside a job in portal mode launches it, potentially asking some survey questions.
Other portions of the interface are hidden from view until portal mode
is exited.

Portal mode can be accessed in two ways:
- via the
 button at the top-right of the Tower interface
- by navigating to
https://<Tower server name>/portal
In Portal mode, the top bar of Tower only has the Tower user button, an Exit Portal button to exit to the main interface, and the Logout button. Portal mode displays two main sections: Job Templates and Jobs
3.3.1. Job Templates
This shows the job templates that are available for the user to run. This list can be searched by Name or Description, and can be sorted by those keys as well. To launch a job template, click the  button. This launches the job, which can be viewed in My Jobs.
Note
Unlike Tower’s main interface, you are not automatically redirected to the Job view for the launched job. This view is still accessible via the View Details button for this job run in the My Jobs panel. This is useful for instances when a job fails and a non-technical user needs an Ansible expert look at what might have gone wrong.
3.3.2. Jobs
This shows the list of jobs that have run in the past.
Sort for jobs specific to you by clicking on the My Jobs button or review all jobs you have access to view by clicking on the All Jobs button, next to the search bar.
- My Jobs: View jobs that you (as the user) ran .
- All Jobs: View your team members’ completed jobs, viewable based on your RBAC permissions.
For each job, you can view the Job ID, the Status of the job (Running, Pending, Successful, or Failed), its start time, and the job Name. The job list can be sorted by any of these fields. Clicking on the Details button opens a new window with the Job Details for that job (refer to Jobs for more information).
3.4. The Dashboard
The central interface to Tower is the Dashboard.
At the top of the Dashboard is a summary of your hosts, inventories, and projects. Each of these is linked to the corresponding object in Tower, for easy access.

At the top of the Dashboard is a summary of your hosts, inventories, and
projects. Each of these is linked to the corresponding object in Tower,
for easy access.
The Dashboard contains four graphs.
3.4.1. Job Status
The Job Status graph displays the number of successful and failed jobs
over a specified time period. You can choose to limit the job types that
are viewed, and to change the time horizon of the graph.
3.4.2. Host Status
The Host Status graph displays, as of the most recent job run, how many
of the configured hosts in your inventory have been marked as
‘Successful’.
3.4.3. Recently Used Job Templates
The Jobs section of this display shows a summary of the most recently used jobs. You can also access this summary by clicking on the Jobs entry in the main navigation menu.
3.4.4. Recently Run Jobs
The Recently Run Jobs section displays which jobs were most recently run, their status, and notes when they were run as well.
3.5. Activity Streams
Most screens in Tower have a  button. Clicking this brings up the
Activity Stream for this object.

An Activity Stream shows all changes for a particular object. For each
change, the Activity Stream shows the time of the event, the user that
initiated the event, and the action. Clicking on the  button shows the
event log for the change.
The Activity Stream can be filtered by the initiating user (or the
system, if it was system initiated), and by any related Tower object,
such as a particular credential, job template, or schedule.
The Activity Stream on the main Dashboard shows the Activity Stream for the entire Tower instance. Most pages in Tower allow viewing an activity stream filtered for that specific object.
