6. Job Output View Changes
With the update of the overall Tower user interface, it is worth noting the changes to how job results are displayed.
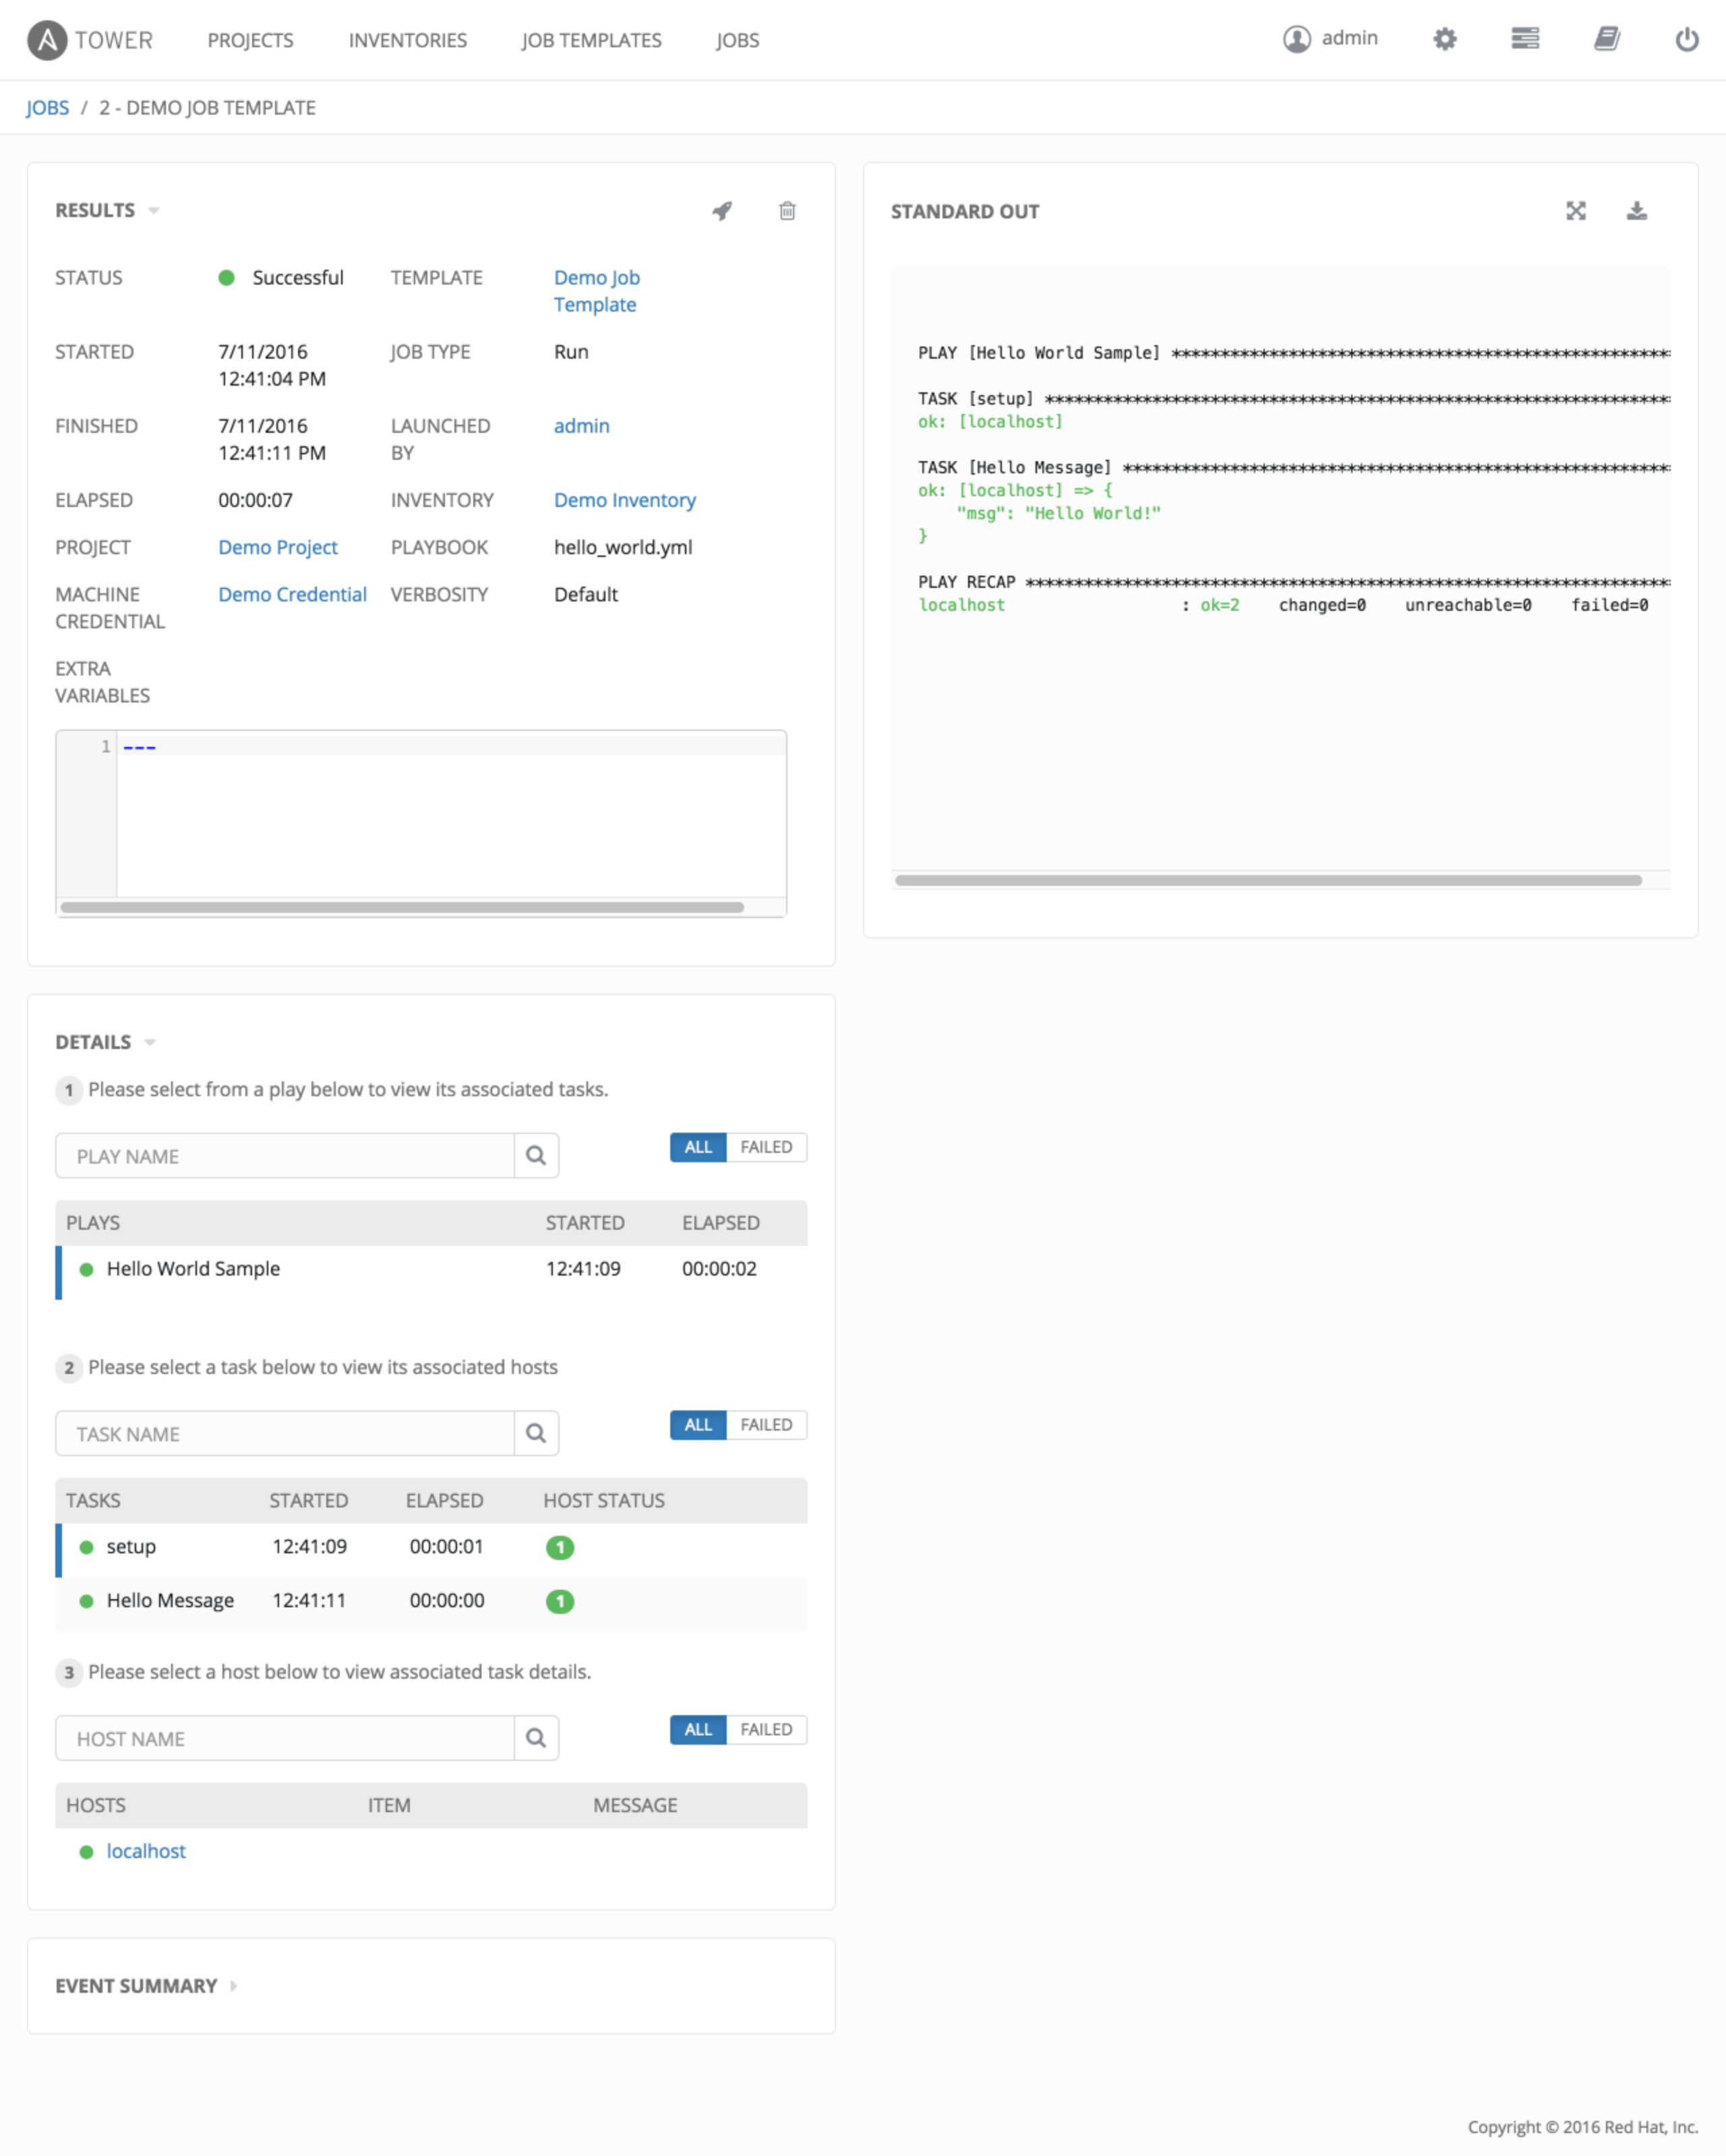
Job results for inventory syncs and SCM updates only show the Results and Standard Out of the job recently Run. Job results for playbook runs consist of Results, Standard Out, Details, and the Event Summary.
For more details regarding Job Results, refer to Jobs in the Ansible Tower User Guide.
6.1. Results
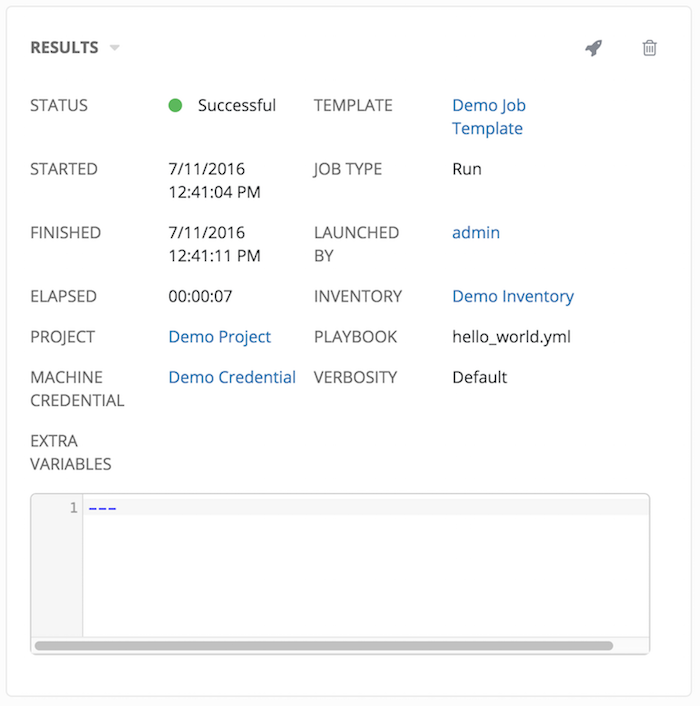
The Results area shows the basic status of the job (Running, Pending, Successful, or Failed), its start and end times, which template was used, how long the job run took, who launched it, and more. The buttons in the top right of the Results view allow you to relaunch or delete the job.
By clicking on these Results entries, where appropriate, you can view the corresponding job templates, projects, and other Tower objects.
6.2. Standard Out
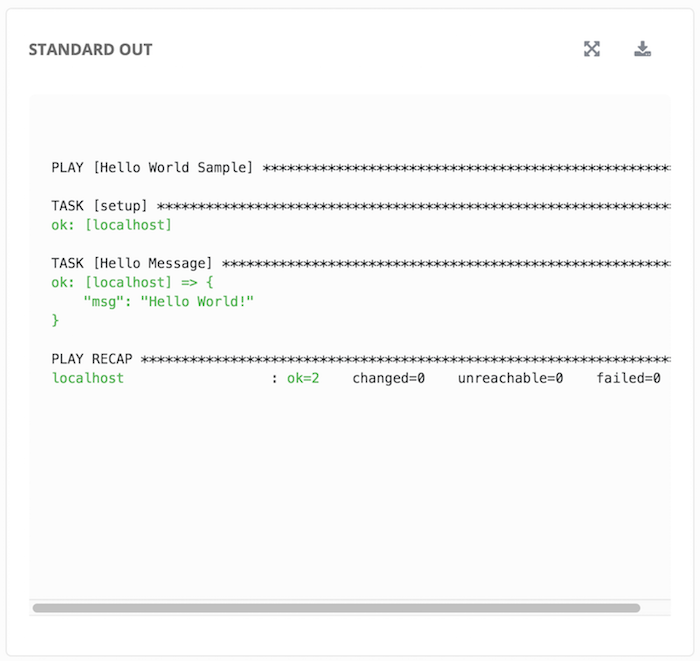
The Standard Out display shows the full results of running the SCM Update or Inventory Sync playbook. This shows the same information you would see if you ran the Ansible playbook using Ansible from the command line, and can be useful for debugging.
Prior to Ansible Tower 3.0, the Standard Out was a separate display and was not included in the overall job results view.
The buttons in the top right corner of the Standard Out display allow you to toggle the output as a main view or to download the output.
6.3. Job Details View
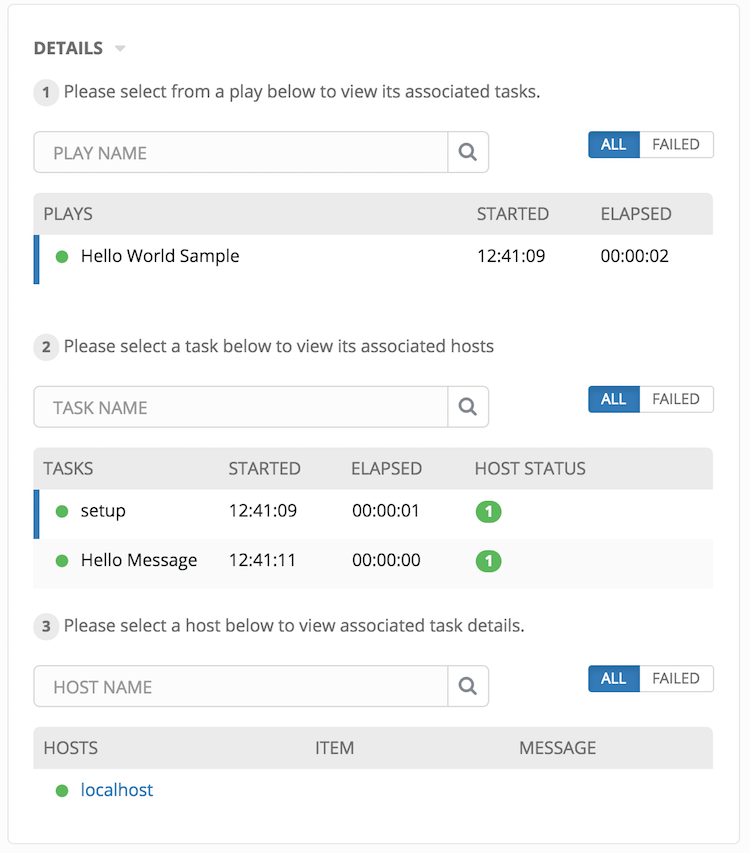
The Job Details view in Ansible Tower 3.0 now offers step-by-step views into Plays, Tasks, and Hosts, walking you through each section of the job results until you drill down into your host informaiton.
6.3.1. Plays
The Plays area shows the plays that were run as part of this playbook. The displayed plays can be filtered by Play Name, and can be limited to show only failed plays (using the ALL/FAIL view toggle).
For each play, Tower shows the Play Name, start time for the play, the elapsed time of the play, the play Name, and whether the play succeeded or failed (indicated by the status dot to the left of the pPlay Name). Clicking on a specific play filters the Tasks and Host Events area to only display tasks and hosts relative to that selected play.

6.3.2. Tasks
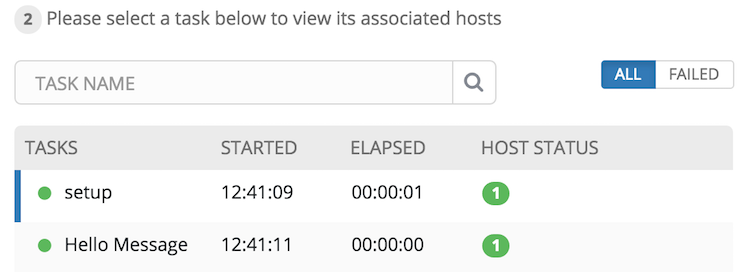
The Tasks area shows the tasks run as part of plays in the playbook. The displayed tasks can be filtered by Task Name, and can be limited to only failed tasks.
For each task, Tower shows the task Name, the start time for the task, the elapsed time of the task, whether the task succeeded or failed. Clicking on a specific task filters the Host Events area to only display hosts relative to that task.
6.3.3. Host Events
The Host Events area shows hosts affected by the selected play and task. For each host, Tower shows the host’s status, its name, and any Item or Message set by that task.

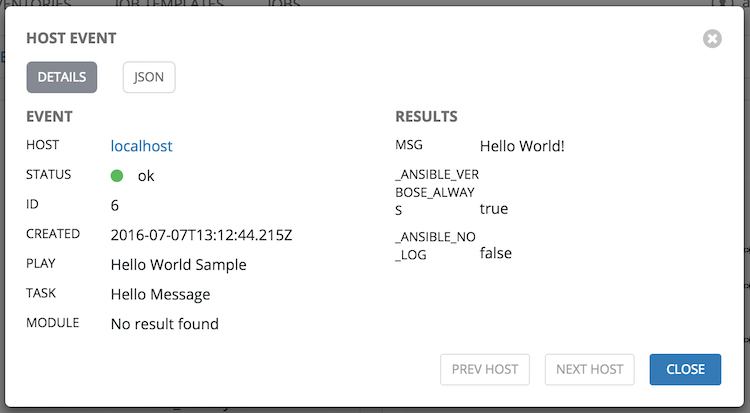
Clicking on the linked hostname brings up the Host Event dialog for that host and task.
The Host Event dialog shows the events for this host and the selected play and task.
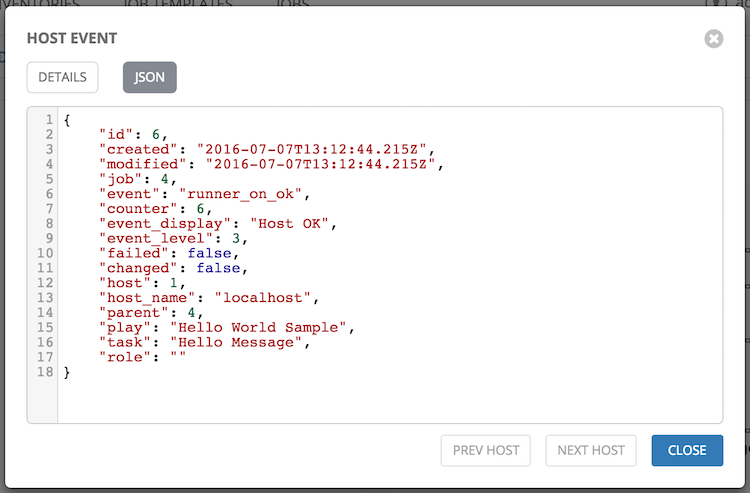
There is also a JSON tab which displays the result in JSON format.
There is also a JSON tab which displays the result in JSON format.
6.4. Event Summary
The Event Summary area shows a summary of events for all hosts affected by this playbook as well as the Host Status Summary.
By default, the Event Summary is collapsed and must be expanded before it can be viewed. Versions of Tower prior to 3.0 always displayed the Event Summary.
Hosts can be filtered by their hostname, and can be limited to showing only changed, failed, OK, and unreachable hosts.
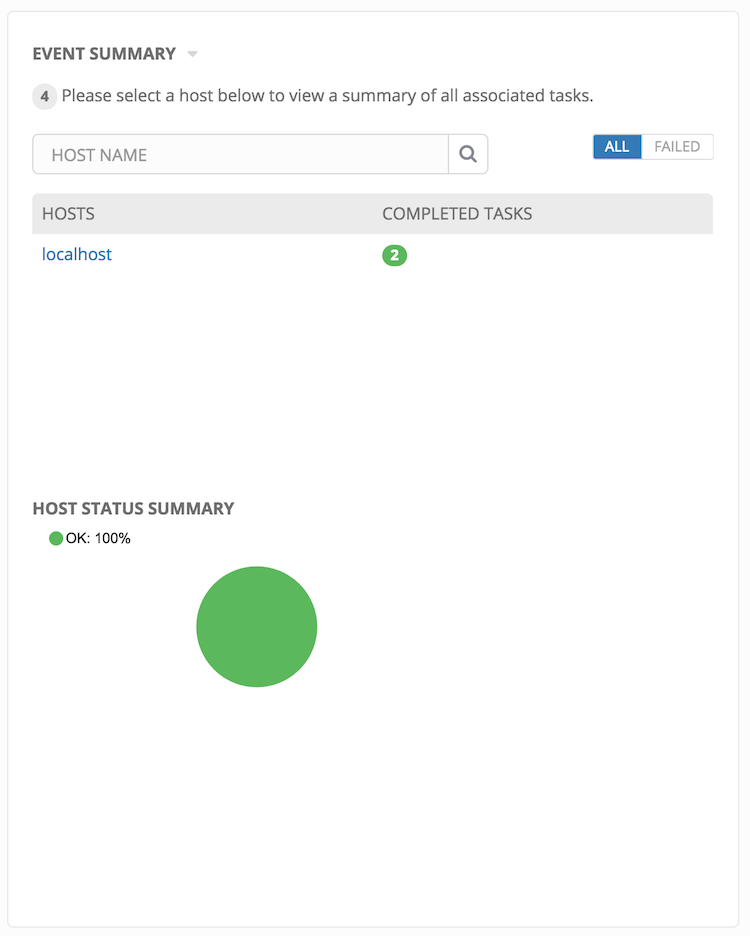
For each host, the Event Summary area shows the hostname and the number of completed tasks for that host, sorted by status.
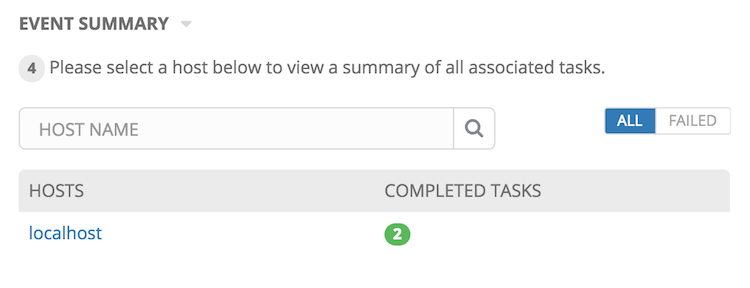
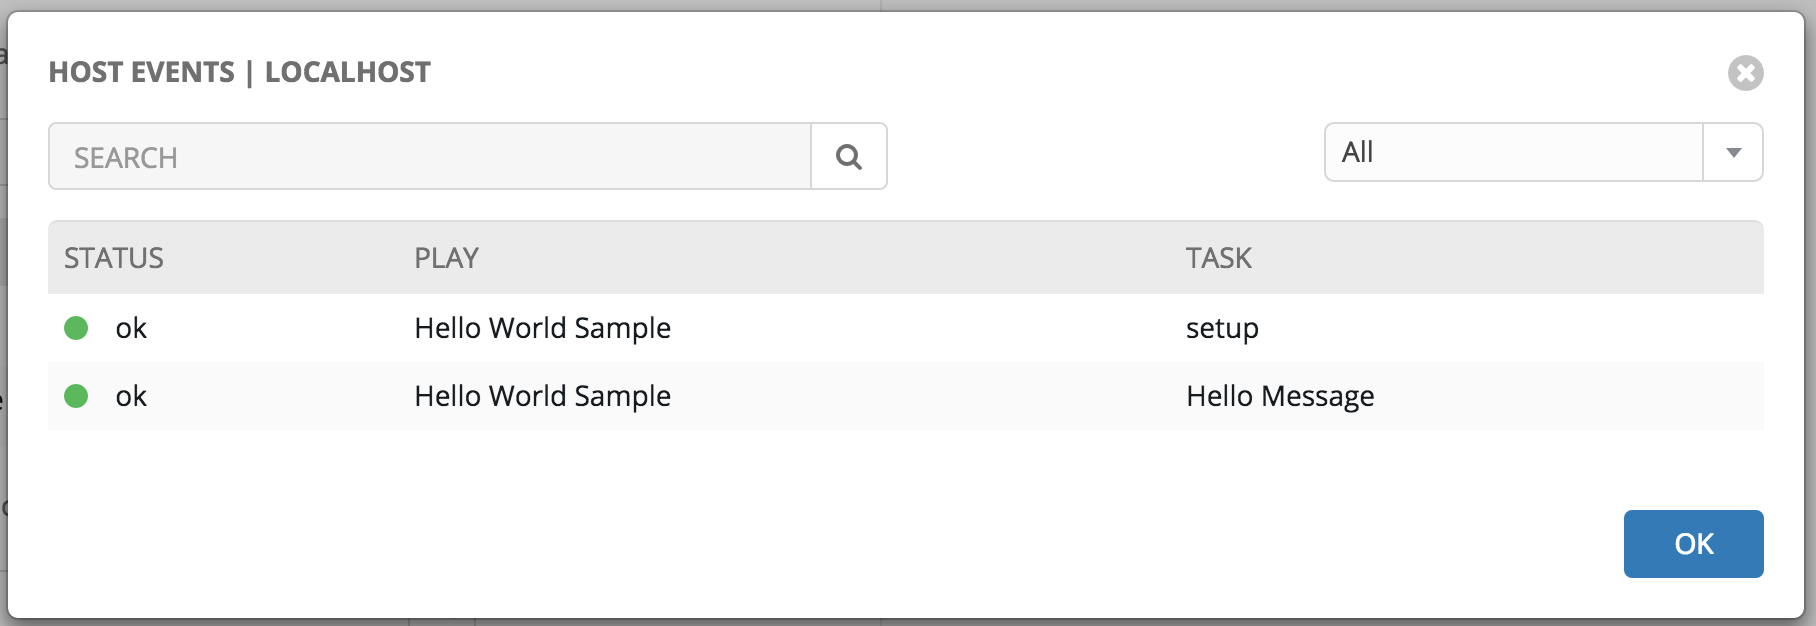
Clicking on the hostname brings up a Host Events dialog, displaying all tasks that affected that host.
This dialog can be filtered by the status of the tasks, as well as by the hostname.
For each event, Tower displays the status, the play name, and the task name.
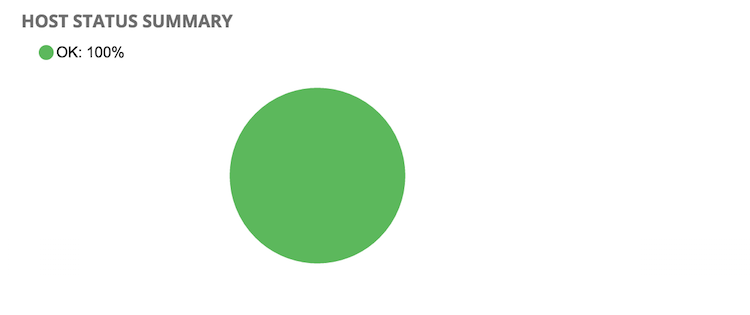
The Host Summary area shows a graph summarizing the status of all hosts affected by this playbook run.
