12. Metrics
Ansible Tower 3.5 introduces a metrics endpoint in the API: /api/v2/metrics/ that surfaces instantaneous metrics about Tower, which can be consumed by system monitoring software like the open source project Prometheus.
The type of data shown at the metrics/ endpoint is Content-type: text/plain and application/json as well. This endpoint contains useful information, such as counts of how many active user sessions there are, or how many jobs are actively running on each Tower node. Prometheus can be configured to scrape these metrics from Tower by hitting the Tower metrics endpoint and storing this data in a time-series database. Clients can later use Prometheus in conjunction with other software like Grafana or Metricsbeat to visualize that data and set up alerts.
12.1. Set up Prometheus
To set up and use Prometheus, you will need to install Prometheus on a virtual machine or container. Refer to the Prometheus documentation for further detail.
In the Prometheus config file (typically
prometheus.yml), specify a<token_value>, a valid user/password for a Tower user you have created, and a<tower_host>.Note
Alternatively, you can provide an OAuth2 token (which can be generated at
/api/v2/users/N/personal_tokens/). By default, the config assumes a user with username=admin and password=password.
Using an OAuth2 Token, created at the
/api/v2/tokensendpoint to authenticate prometheus with Tower, the following example provides a valid scrape config if the URL for your Tower’s metrics endpoint washttps://tower_host:443/metrics.scrape_configs - job_name: 'tower' tls_config: insecure_skip_verify: True metrics_path: /api/v2/metrics scrape_interval: 5s scheme: https bearer_token: <token_value> # basic_auth: # username: admin # password: password static_configs: - targets: - <tower_host>For help configuring other aspects of Prometheus, such as alerts and service discovery configurations, refer to the Prometheus configuration docs.
If Prometheus is already running, you must restart it in order to apply the configuration changes by making a POST to the reload endpoint, or by killing the Prometheus process or service.
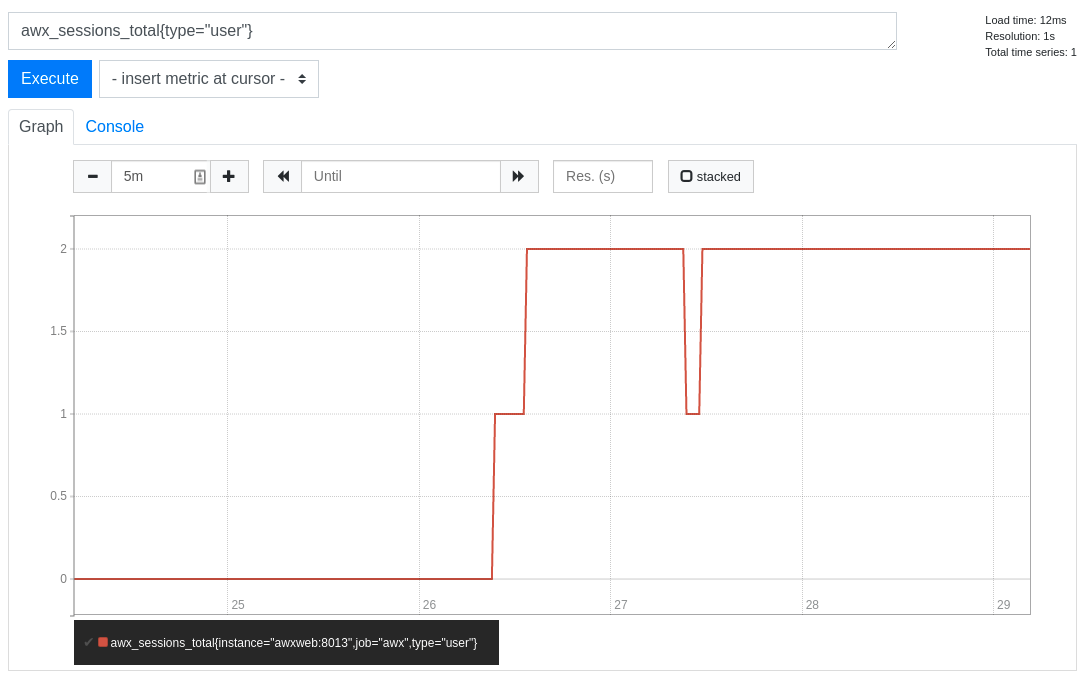
Use a browser to navigate to your graph in the Prometheus UI at
http://your_prometheus:9090/graphand test out some queries. For example, you can query the current number of active Tower user sessions by executing:awx_sessions_total{type="user"}.
Refer to the metrics endpoint in the Tower API for your instance (api/v2/metrics) for more ways to query.