16. Resource Profiling
Ansible Tower 3.6 introduced the ability to collect raw performance data including CPU, memory, and PID count during the execution of a playbook run. This is made possible by resource profiling capabilities provided by Runner, which uses Linux control groups (‘cgroups’) to measure actual resource usage over time. For more information about cgroups, refer to Introduction to Control Groups.
When you install Ansible Tower 3.6, Tower automatically creates the cgroup so that Runner can use it.
16.1. Enable resource profiling
To enable Runner’s resource profiling feature in the Tower User Interface:
From the left navigation bar, hover over the Settings (
 ) icon and select Jobs or click the Jobs tab from the Settings screen.
Use the toggle to turn on the Enable Resource Profiling On All Tower Jobs setting to collect data on all jobs.
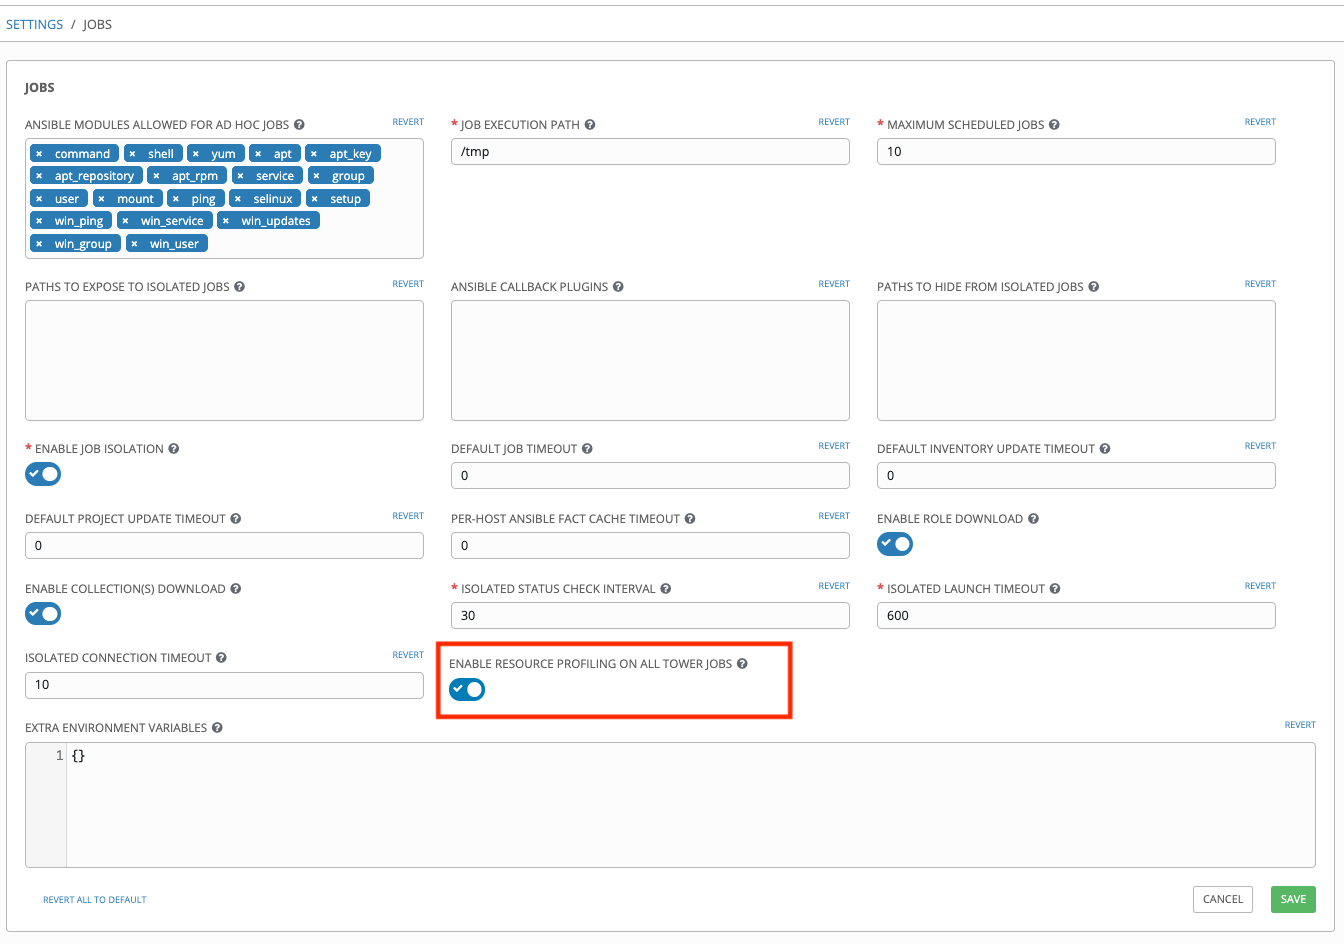
Click Save to save your preferences.
After performance data has been collected for a job, it is stored under /var/log/tower/playbook_profiling/<job_id>/. On a cluster, performance data is stored on the Tower instance that executed the job. If a job is executed using an isolated instance, then the data is collected from the isolated node and stored on the controller that was used to deliver the job to the the isolated node.
Three data files (corresponding to CPU, memory, and PID count) are created for each task. Each file contains data in JSON text format; each line of the file will begin with a record separator (RS), continue with a JSON dictionary, and conclude with a line feed (LF) character. Note that if a task runs very quickly, it is possible that performance data may not be collected at all for that task, in which case one or more of the performance data files for that task will not be created.
Refer to the current Runner docs for more detail on what the performance data looks like, along with some actual sample data.