5. The User Interface
The User Interface offers a friendly graphical framework for your IT orchestration needs. The left navigation bar provides quick access to resources, such as Projects, Inventories, Job Templates, and Jobs.
참고
The new controller User Interface is available for tech preview and is subject to change in a future release. To preview the new UI, click the Enable Preview of New User Interface toggle to On from the Miscellaneous System option of the Settings menu.
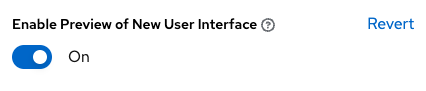
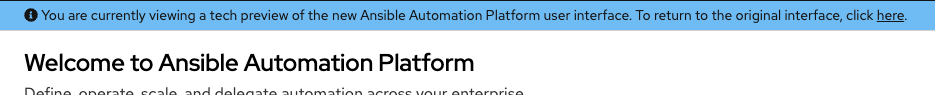
After saving, logout and log back in to access the new UI from the preview banner. To return to the current UI, click the link on the top banner where indicated.
Across the top-right side of the interface, you can access your user profile, the About page, view related documentation, and log out. Right below these options, you can view the activity stream for that user by clicking on the Activity Stream  button.

5.1. Views
The User Interface provides several options for viewing information.
5.1.1. Dashboard view
The Dashboard view begins with a summary of your hosts, inventories, and projects. Each of these is linked to the corresponding objects for easy access.
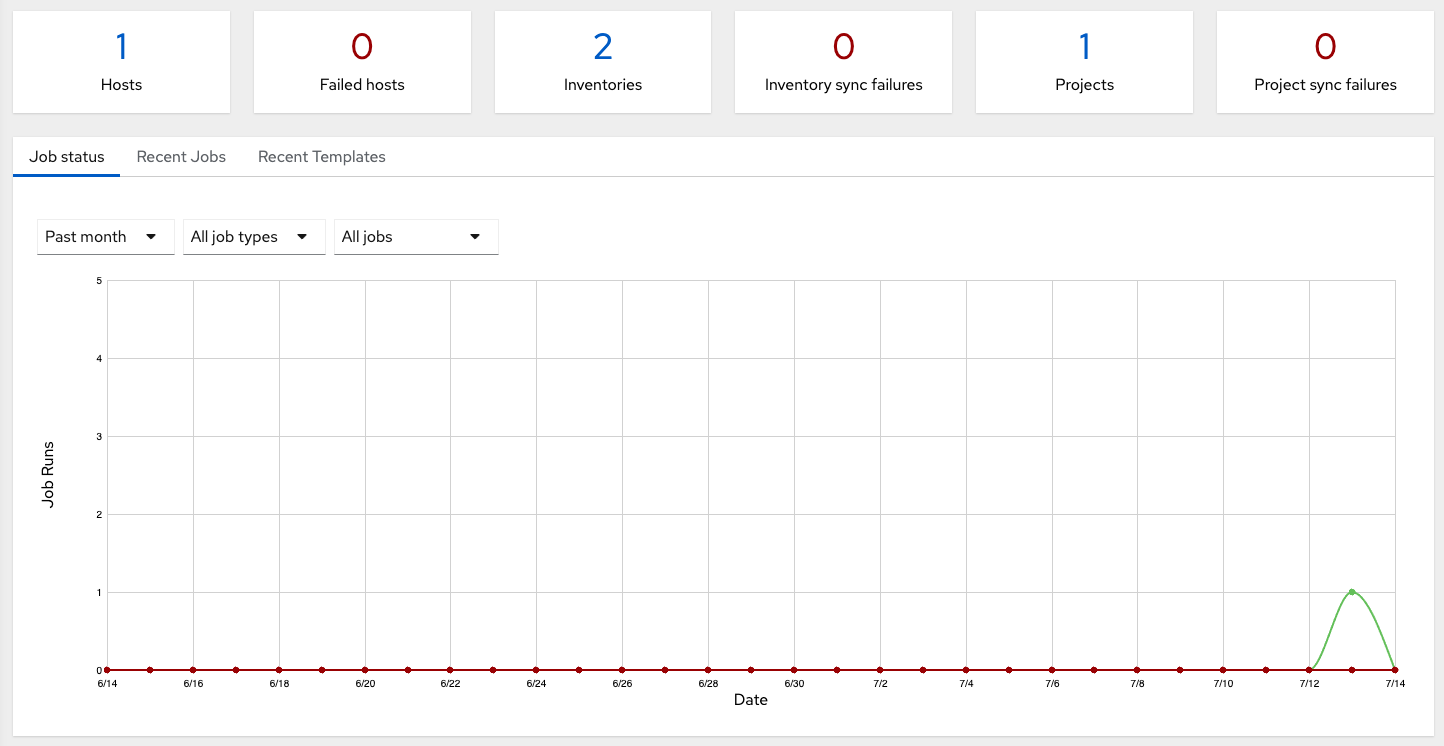
On the main Dashboard screen, a summary appears listing your current Job Status. The Job Status graph displays the number of successful and failed jobs over a specified time period. You can choose to limit the job types that are viewed, and to change the time horizon of the graph.
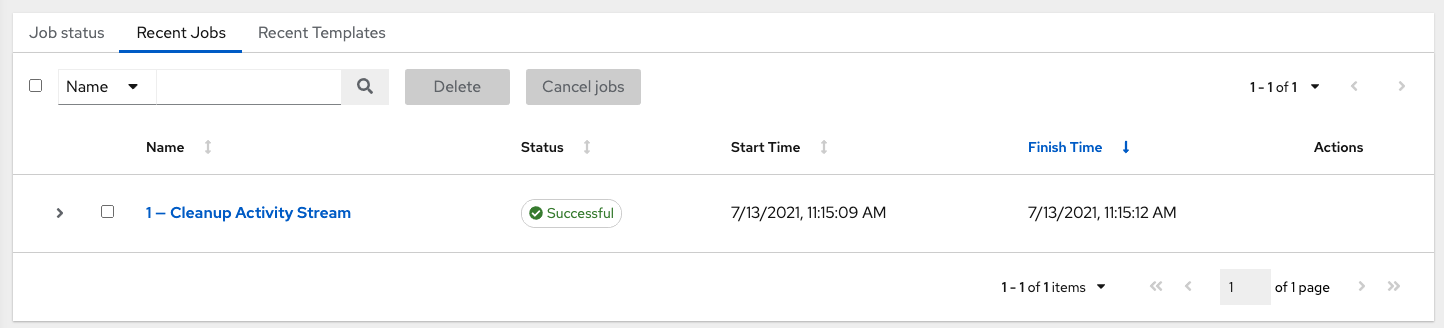
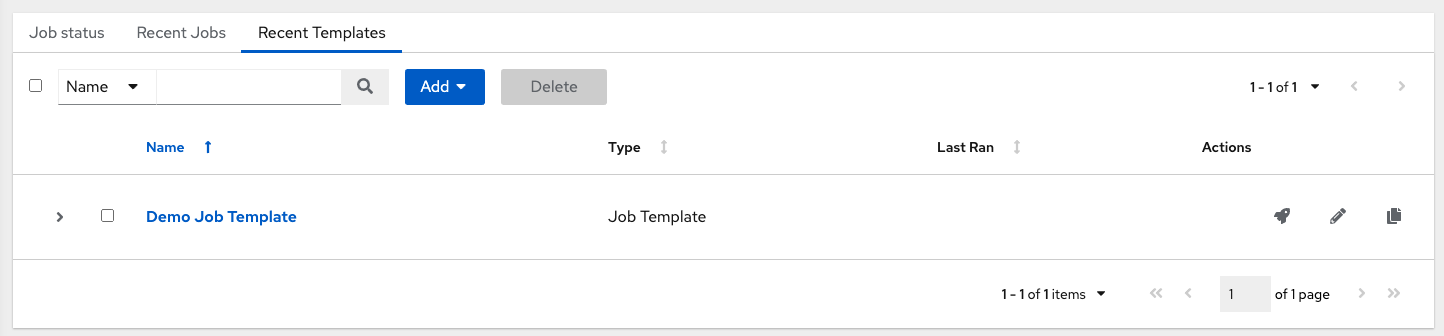
Also available for view are summaries of Recent Jobs and Recent Templates on their respective tabs.
The Recent Jobs section displays which jobs were most recently run, their status, and time when they were run as well.
The Recent Templates section of this display shows a summary of the most recently used templates. You can also access this summary by clicking Templates from the left navigation bar.
참고
Clicking on Dashboard from the left navigation bar or the Ansible Automation Platform logo at any time returns you to the Dashboard.
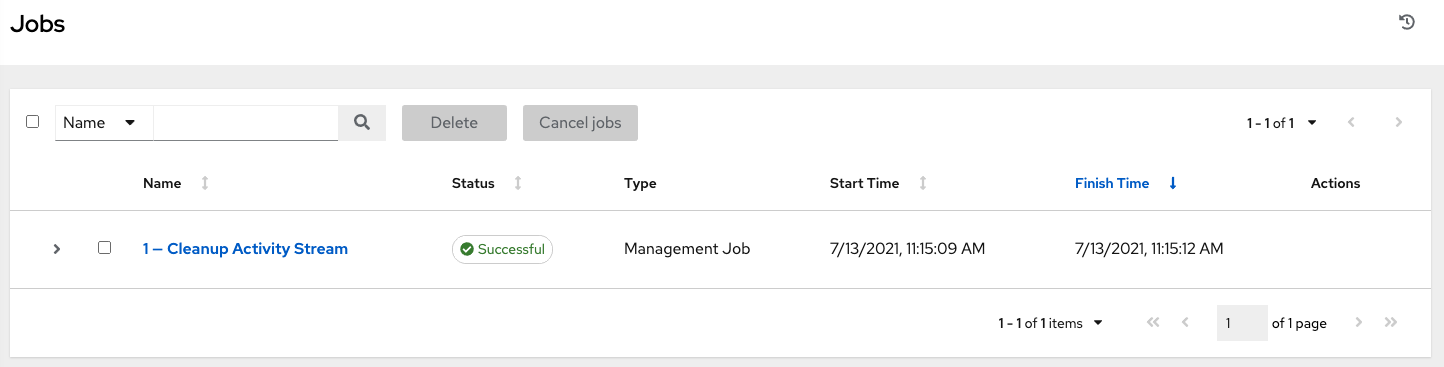
5.1.2. Jobs view
Access the Jobs view by clicking Jobs from the left navigation bar. This view shows all the jobs that have ran, including projects, templates, management jobs, SCM updates, playbook runs, etc.
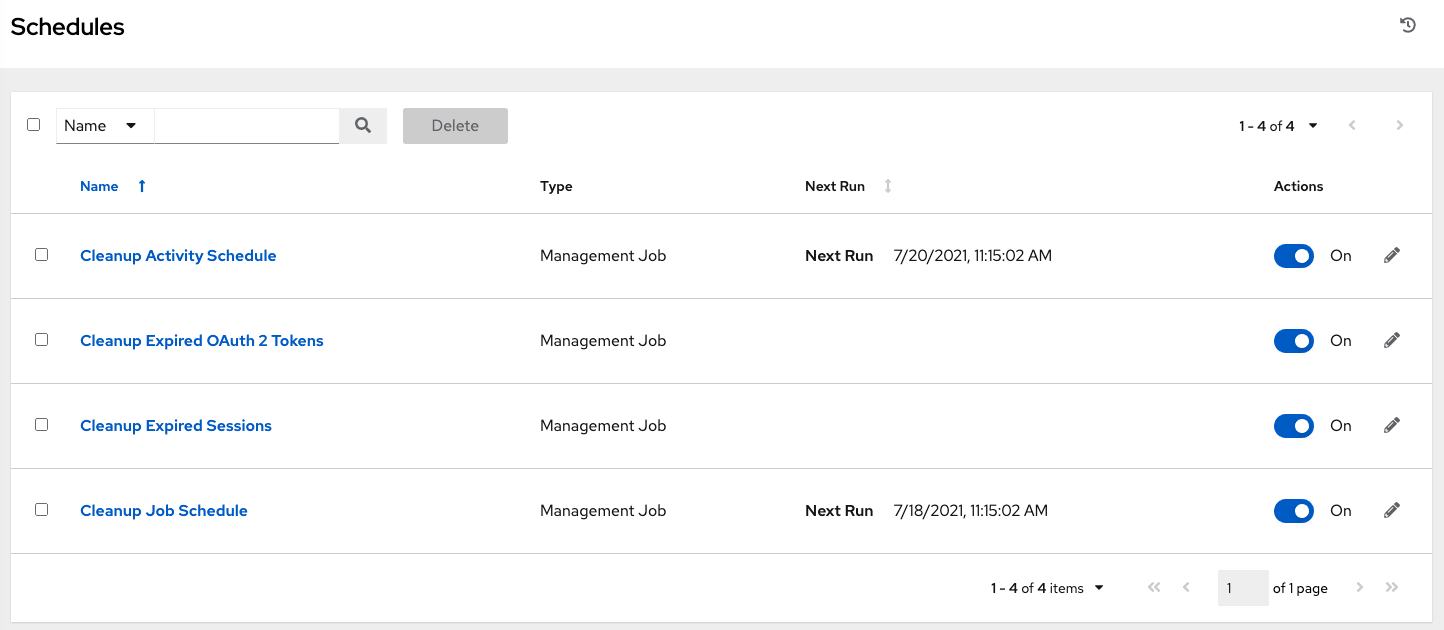
5.1.3. Schedules view
Access the Schedules view by clicking Schedules from the left navigation bar. This view shows all the scheduled jobs that are configured.
5.1.4. Activity Stream
Most screens have an Activity Stream () button. Clicking this brings up the
Activity Stream for this object.
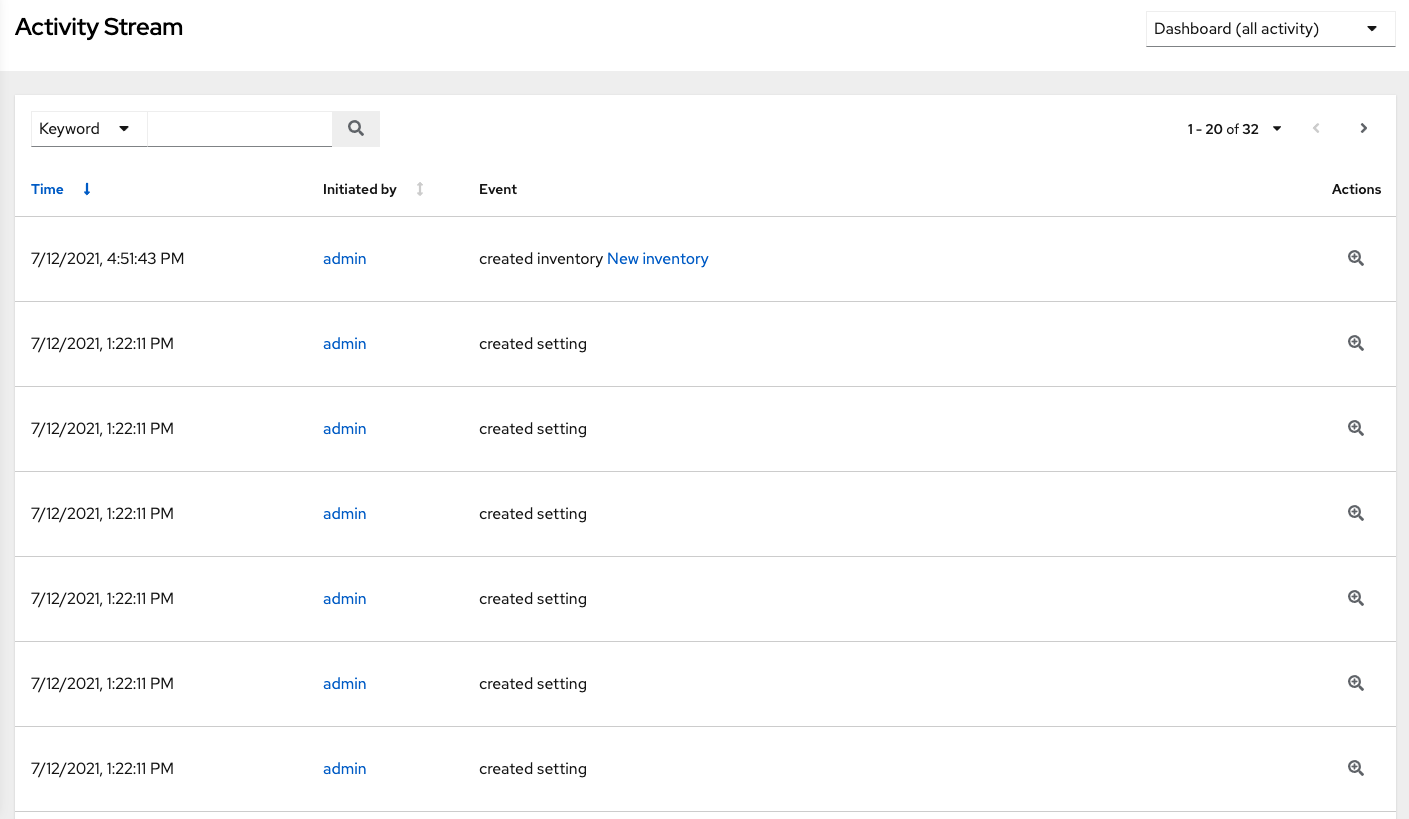
An Activity Stream shows all changes for a particular object. For each change, the Activity Stream shows the time of the event, the user that
initiated the event, and the action. The information displayed varies depending on the type of event. Clicking on the Examine ( ) button shows the event log for the change.
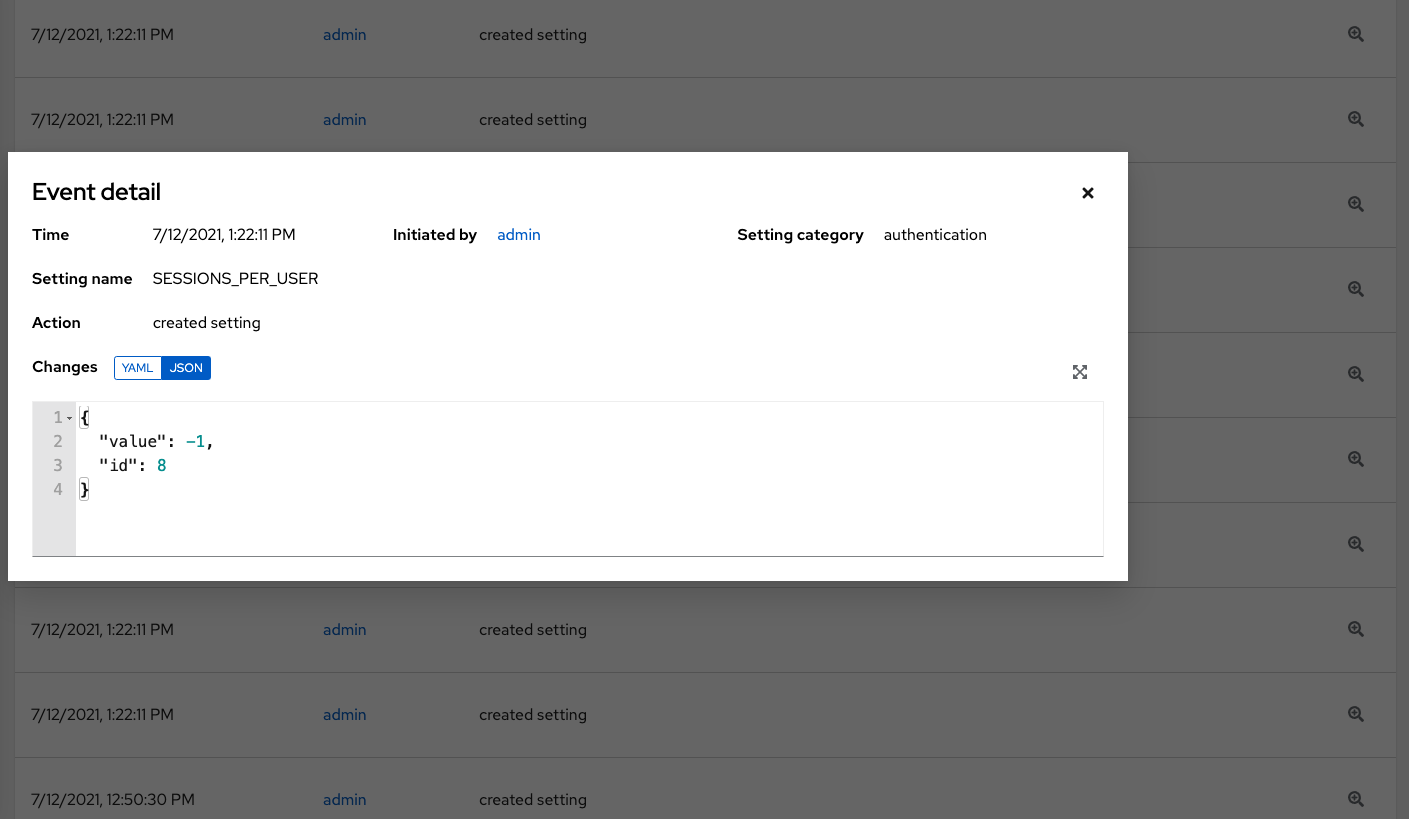
The Activity Stream can be filtered by the initiating user (or the system, if it was system initiated), and by any related object, such as a particular credential, job template, or schedule.
The Activity Stream on the main Dashboard shows the Activity Stream for the entire instance. Most pages allow viewing an activity stream filtered for that specific object.
5.1.5. Workflow Approvals
Access this view to see your workflow approval queue. The list contains actions that require you to approve or deny before a job can proceed. See Approval nodes for further detail.
5.1.6. Host Metrics
This view allows you to view the activity associated with hosts, which include counts on those that have been automated, used in inventories, and deleted.
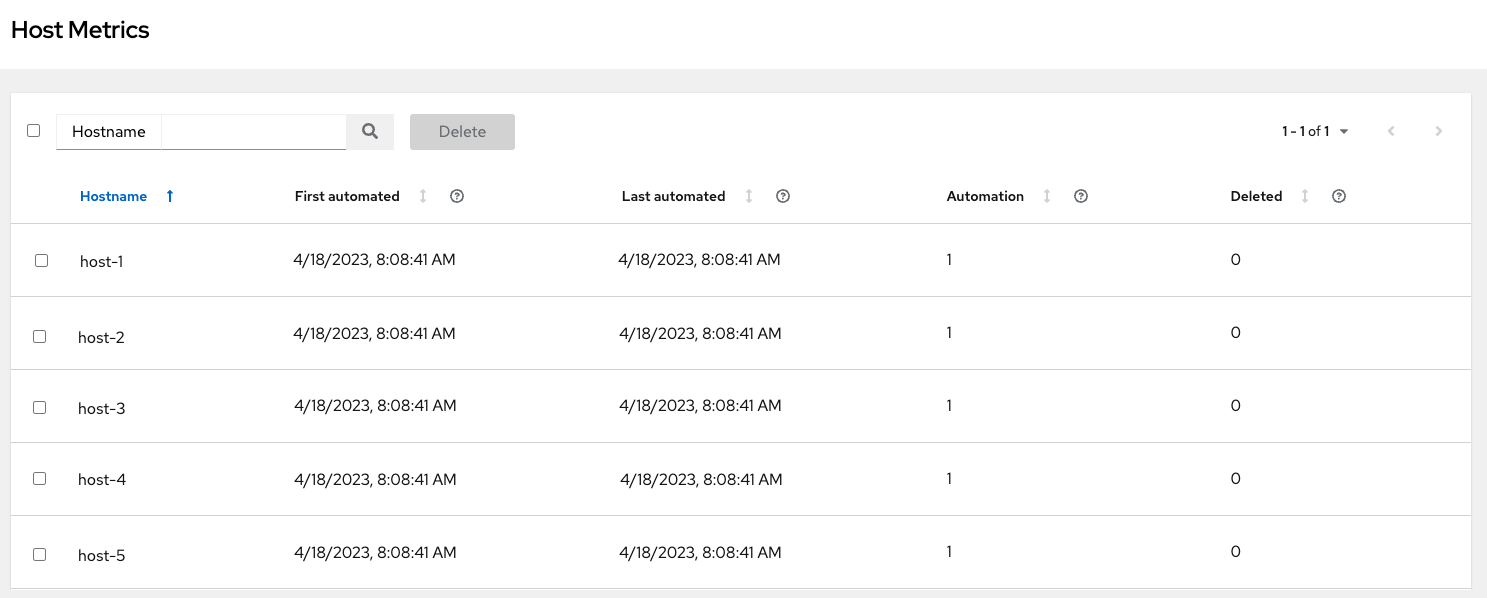
See subscription compliance for further detail.
5.2. Resources and Access
The Resources and Access menus provide you access to the various components of automation controller and allow you to configure who has permissions for those resources:
Templates (Job Templates and Workflow Job Templates)
5.3. Administration
The Administration menu provides access to the various administrative options. From here, you can create, view, and edit:
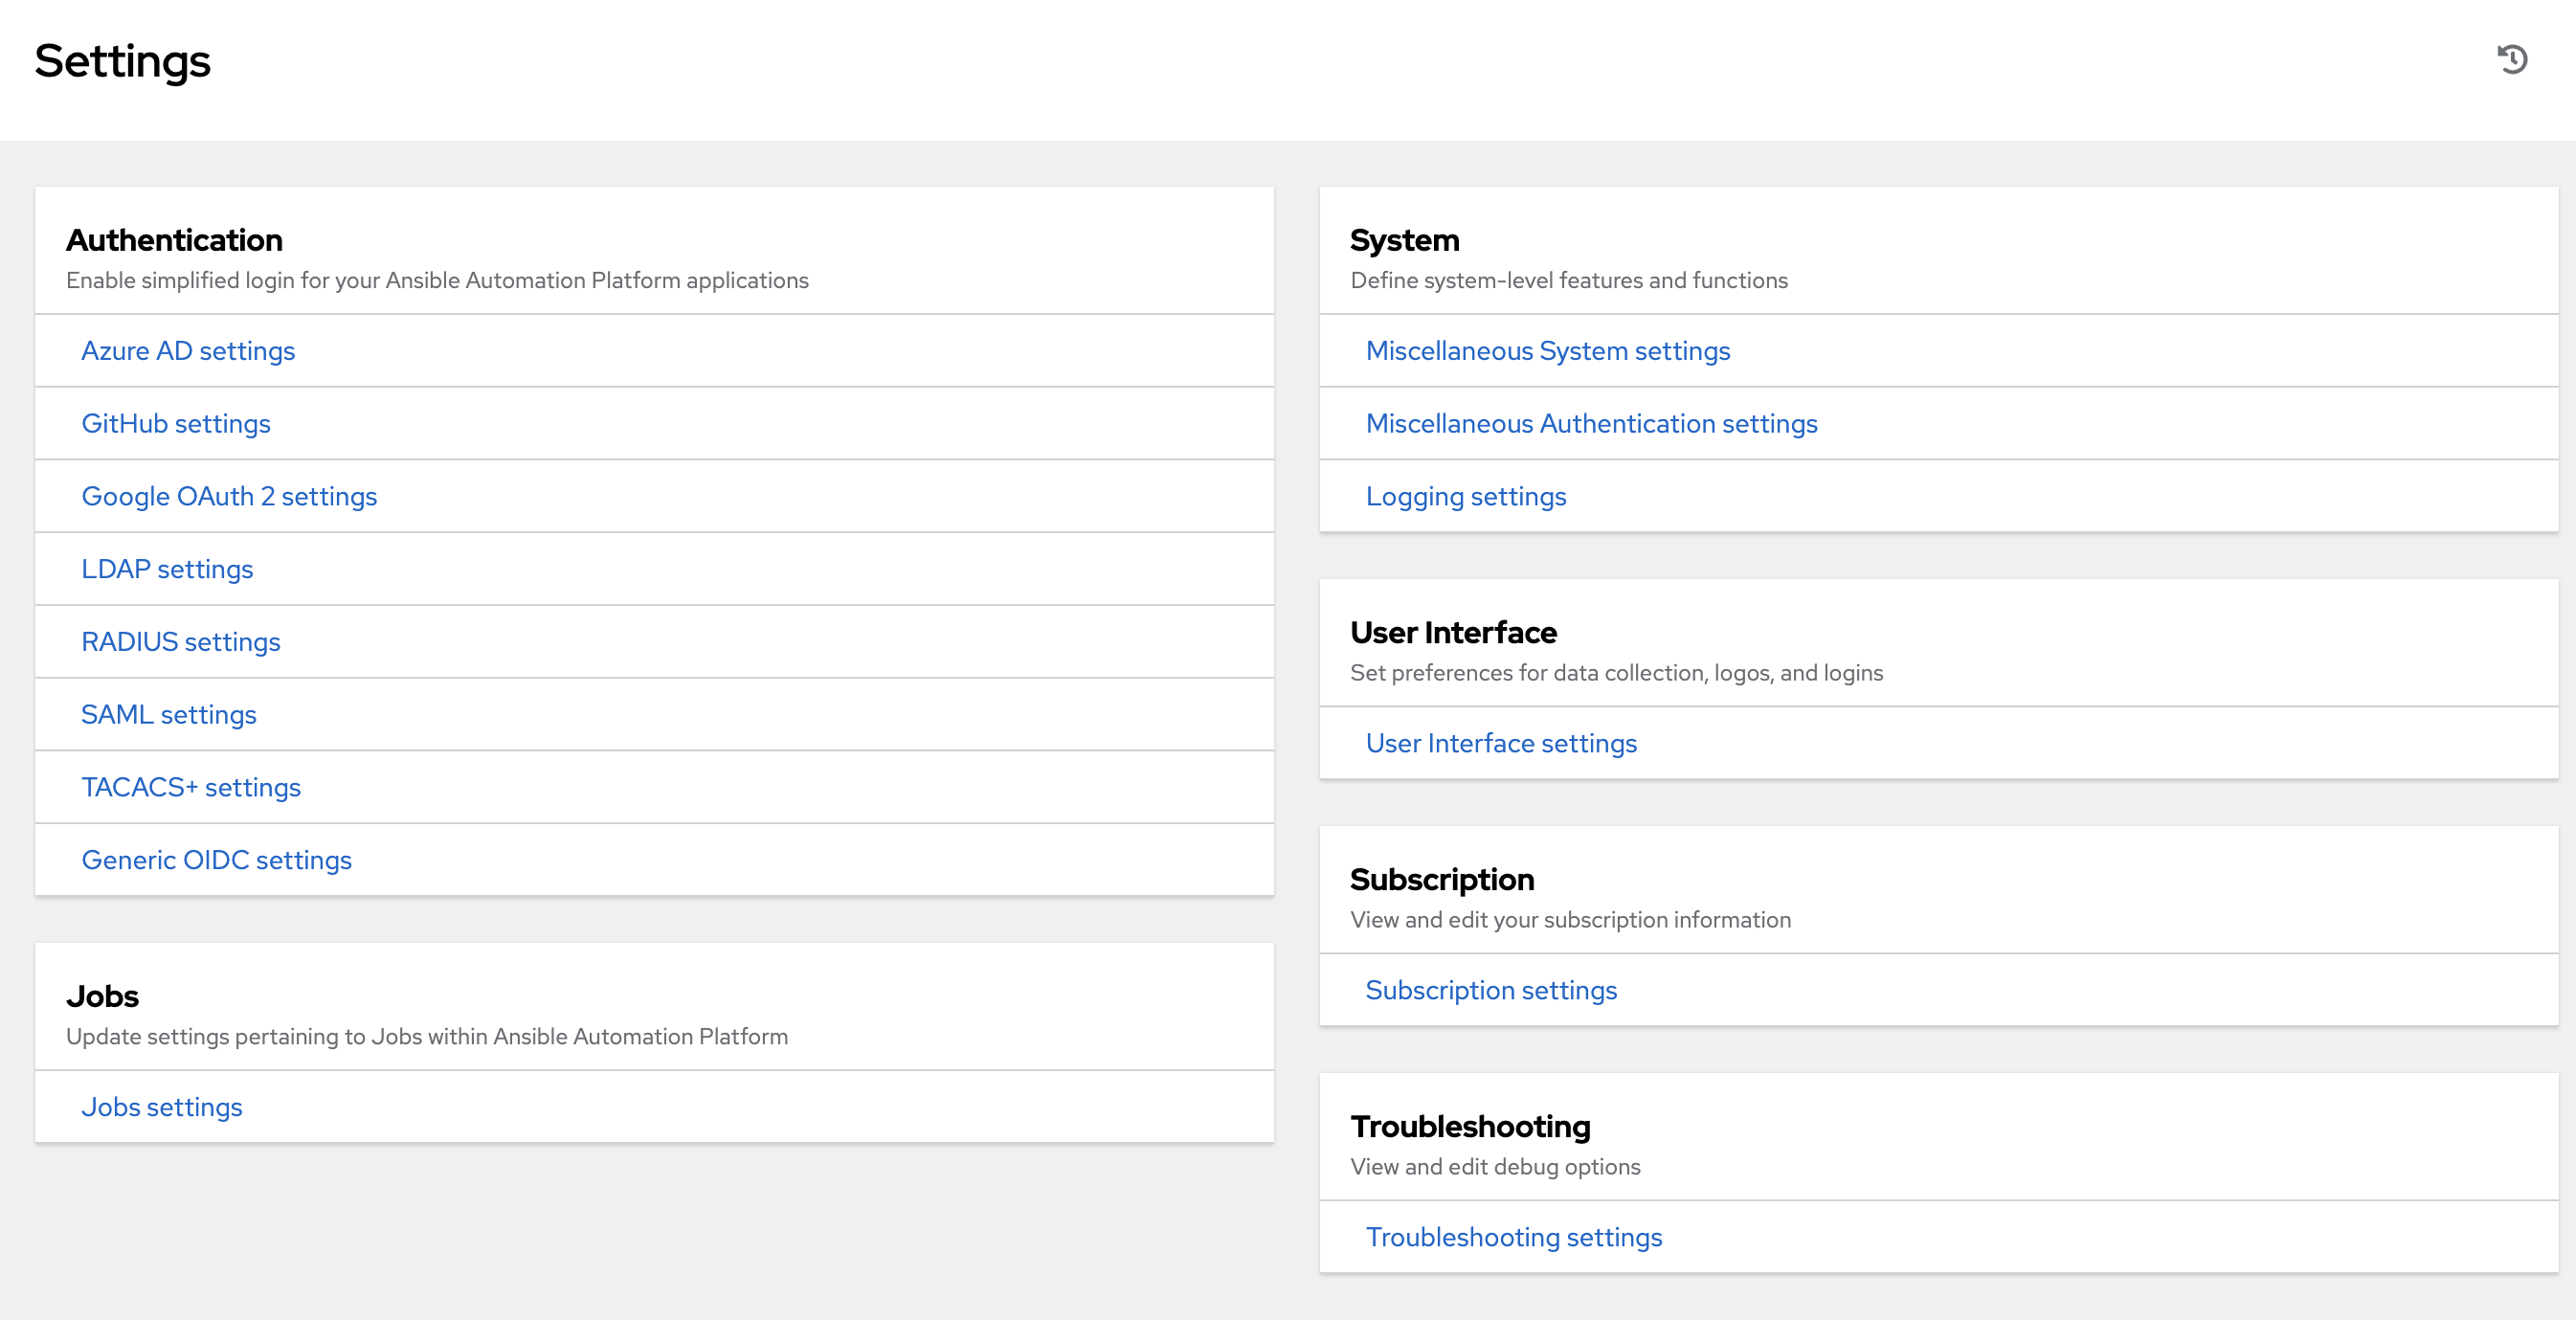
6. The Settings Menu
Configuring global and system-level settings is accomplished through the Settings menu, which is described in further detail in the proceeding section. The Settings menu offers access to administrative configuration options.
To enter the Settings window for automation controller, click Settings from the left navigation bar. This page allows you to modify your controller’s configuration, such as settings associated with authentication, jobs, system, user interface, and view or retrieve your subscription information.
For more information on configuring these settings, refer to Controller Configuration section of the Automation Controller Administration Guide.