29. Usability Analytics and Data Collection
Usability data collection is included with Tower to collect data to better understand how Tower users specifically interact with Tower, to help enhance future releases, and to continue streamlining your user experience.
Only users installing a trial of Tower or a fresh installation of Tower are opted-in for this data collection.
If you want to change how you participate in this analytics collection, you can opt out or change your settings using the Configure Tower user interface, accessible from the Settings (![]() ) icon from the left navigation bar.
) icon from the left navigation bar.
Ansible Tower collects user data automatically to help improve the Tower product. You can control the way Tower collects data by setting your participation level in the User Interface tab in the settings menu.
Select the desired level of data collection from the User Analytics Tracking State drop-down list:
Off: Prevents any data collection.
Anonymous: Enables data collection without your specific user data.
Detailed: Enables data collection including your specific user data.
Click Save to apply the settings or Cancel to abandon the changes.
For more information, see the Red Hat privacy policy at https://www.redhat.com/en/about/privacy-policy.
29.1. Automation Analytics
When you imported your license for the first time, you were given options related to the collection of data that help improve the product. For opt-in of Automation analytics to have any effect, your instance of Ansible Tower must be running on Red Hat Enterprise Linux. Much like Red Hat Insights, Automation Analytics is built to only collect the minimum amount of data needed. Automation Analytics collects certain classes of data from Ansible Tower:
Basic configuration, like which features are enabled, and what operating system is being used.
Topology and status of the Tower environment and hosts, including capacity and health
Counts of automation resources:
organizations, teams, and users
inventories and hosts
credentials (indexed by type)
projects (indexed by type)
templates
schedules
active sessions
running and pending jobs
Job execution details (start time, finish time, launch type, and success)
Automation task details (success, host id, playbook/role, task name, and module used)
No credential secrets, personal data, automation variables, or task output is gathered.
In order to enable this feature, turn on data collection for Automation Analytics and enter your Red Hat customer credentials in the Misc. System tab of the System configuration window located in the Settings menu.
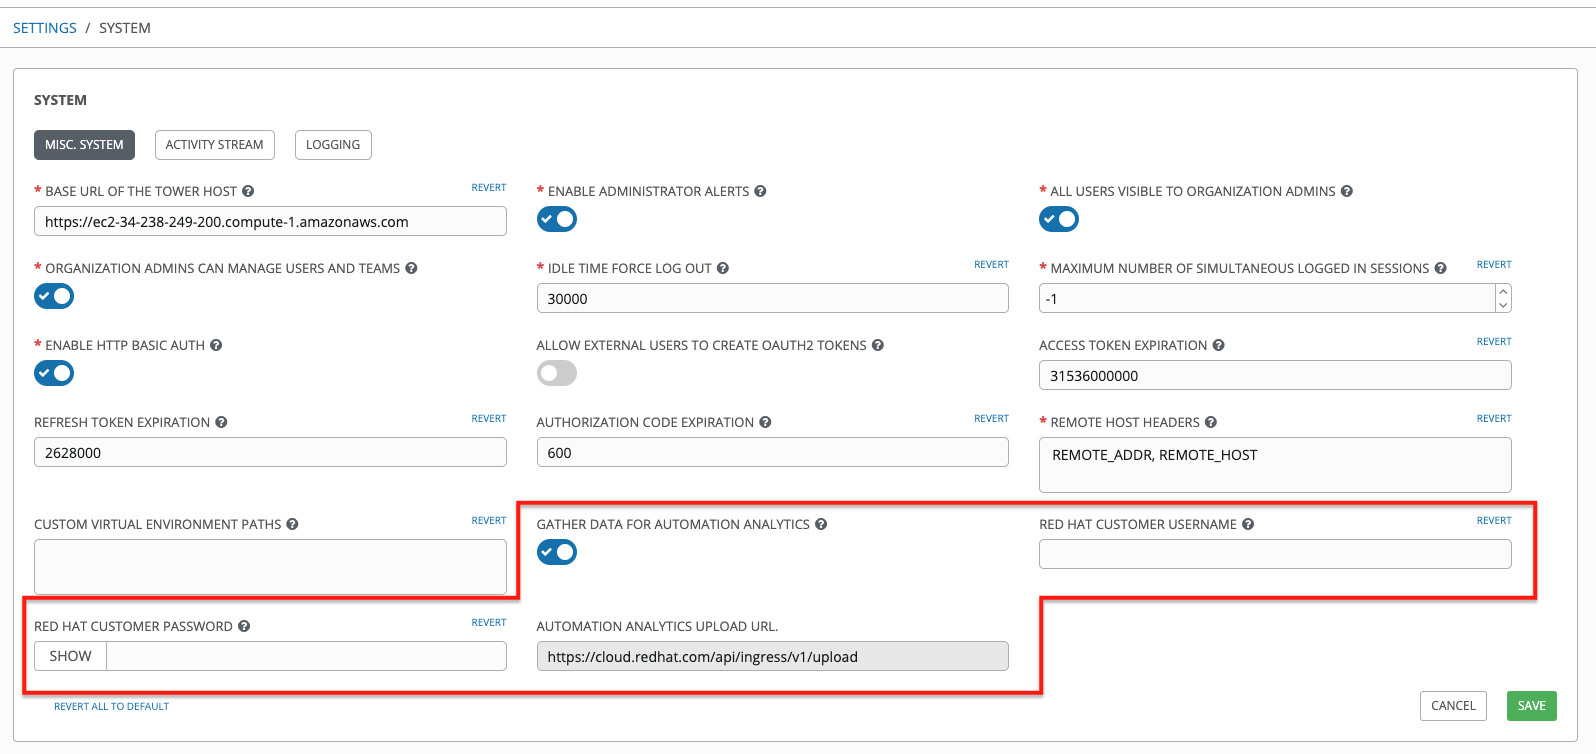
Note that the Automation Analytics Upload URL field is pre-populated with the location to which the collection of insights data will be uploaded.
By default, the Automation Analytics data is collected every 4 hours and upon enabling the feature, data will be collected up to a month back (or until the previous collection). You may turn off this data collection at any time in the Misc. System tab of the System configuration window. You can use awx-manage gather_analytics (without --ship) to inspect the data that Tower sends so you can satisfy your data collection concerns.
This setting can also be enabled via the API by specifying INSIGHTS_TRACKING_STATE = True in either of these endpoints:
api/v2/settings/allapi/v2/settings/system
The automation analytics generated from this data collection will be found on the Red Hat Cloud Services portal.
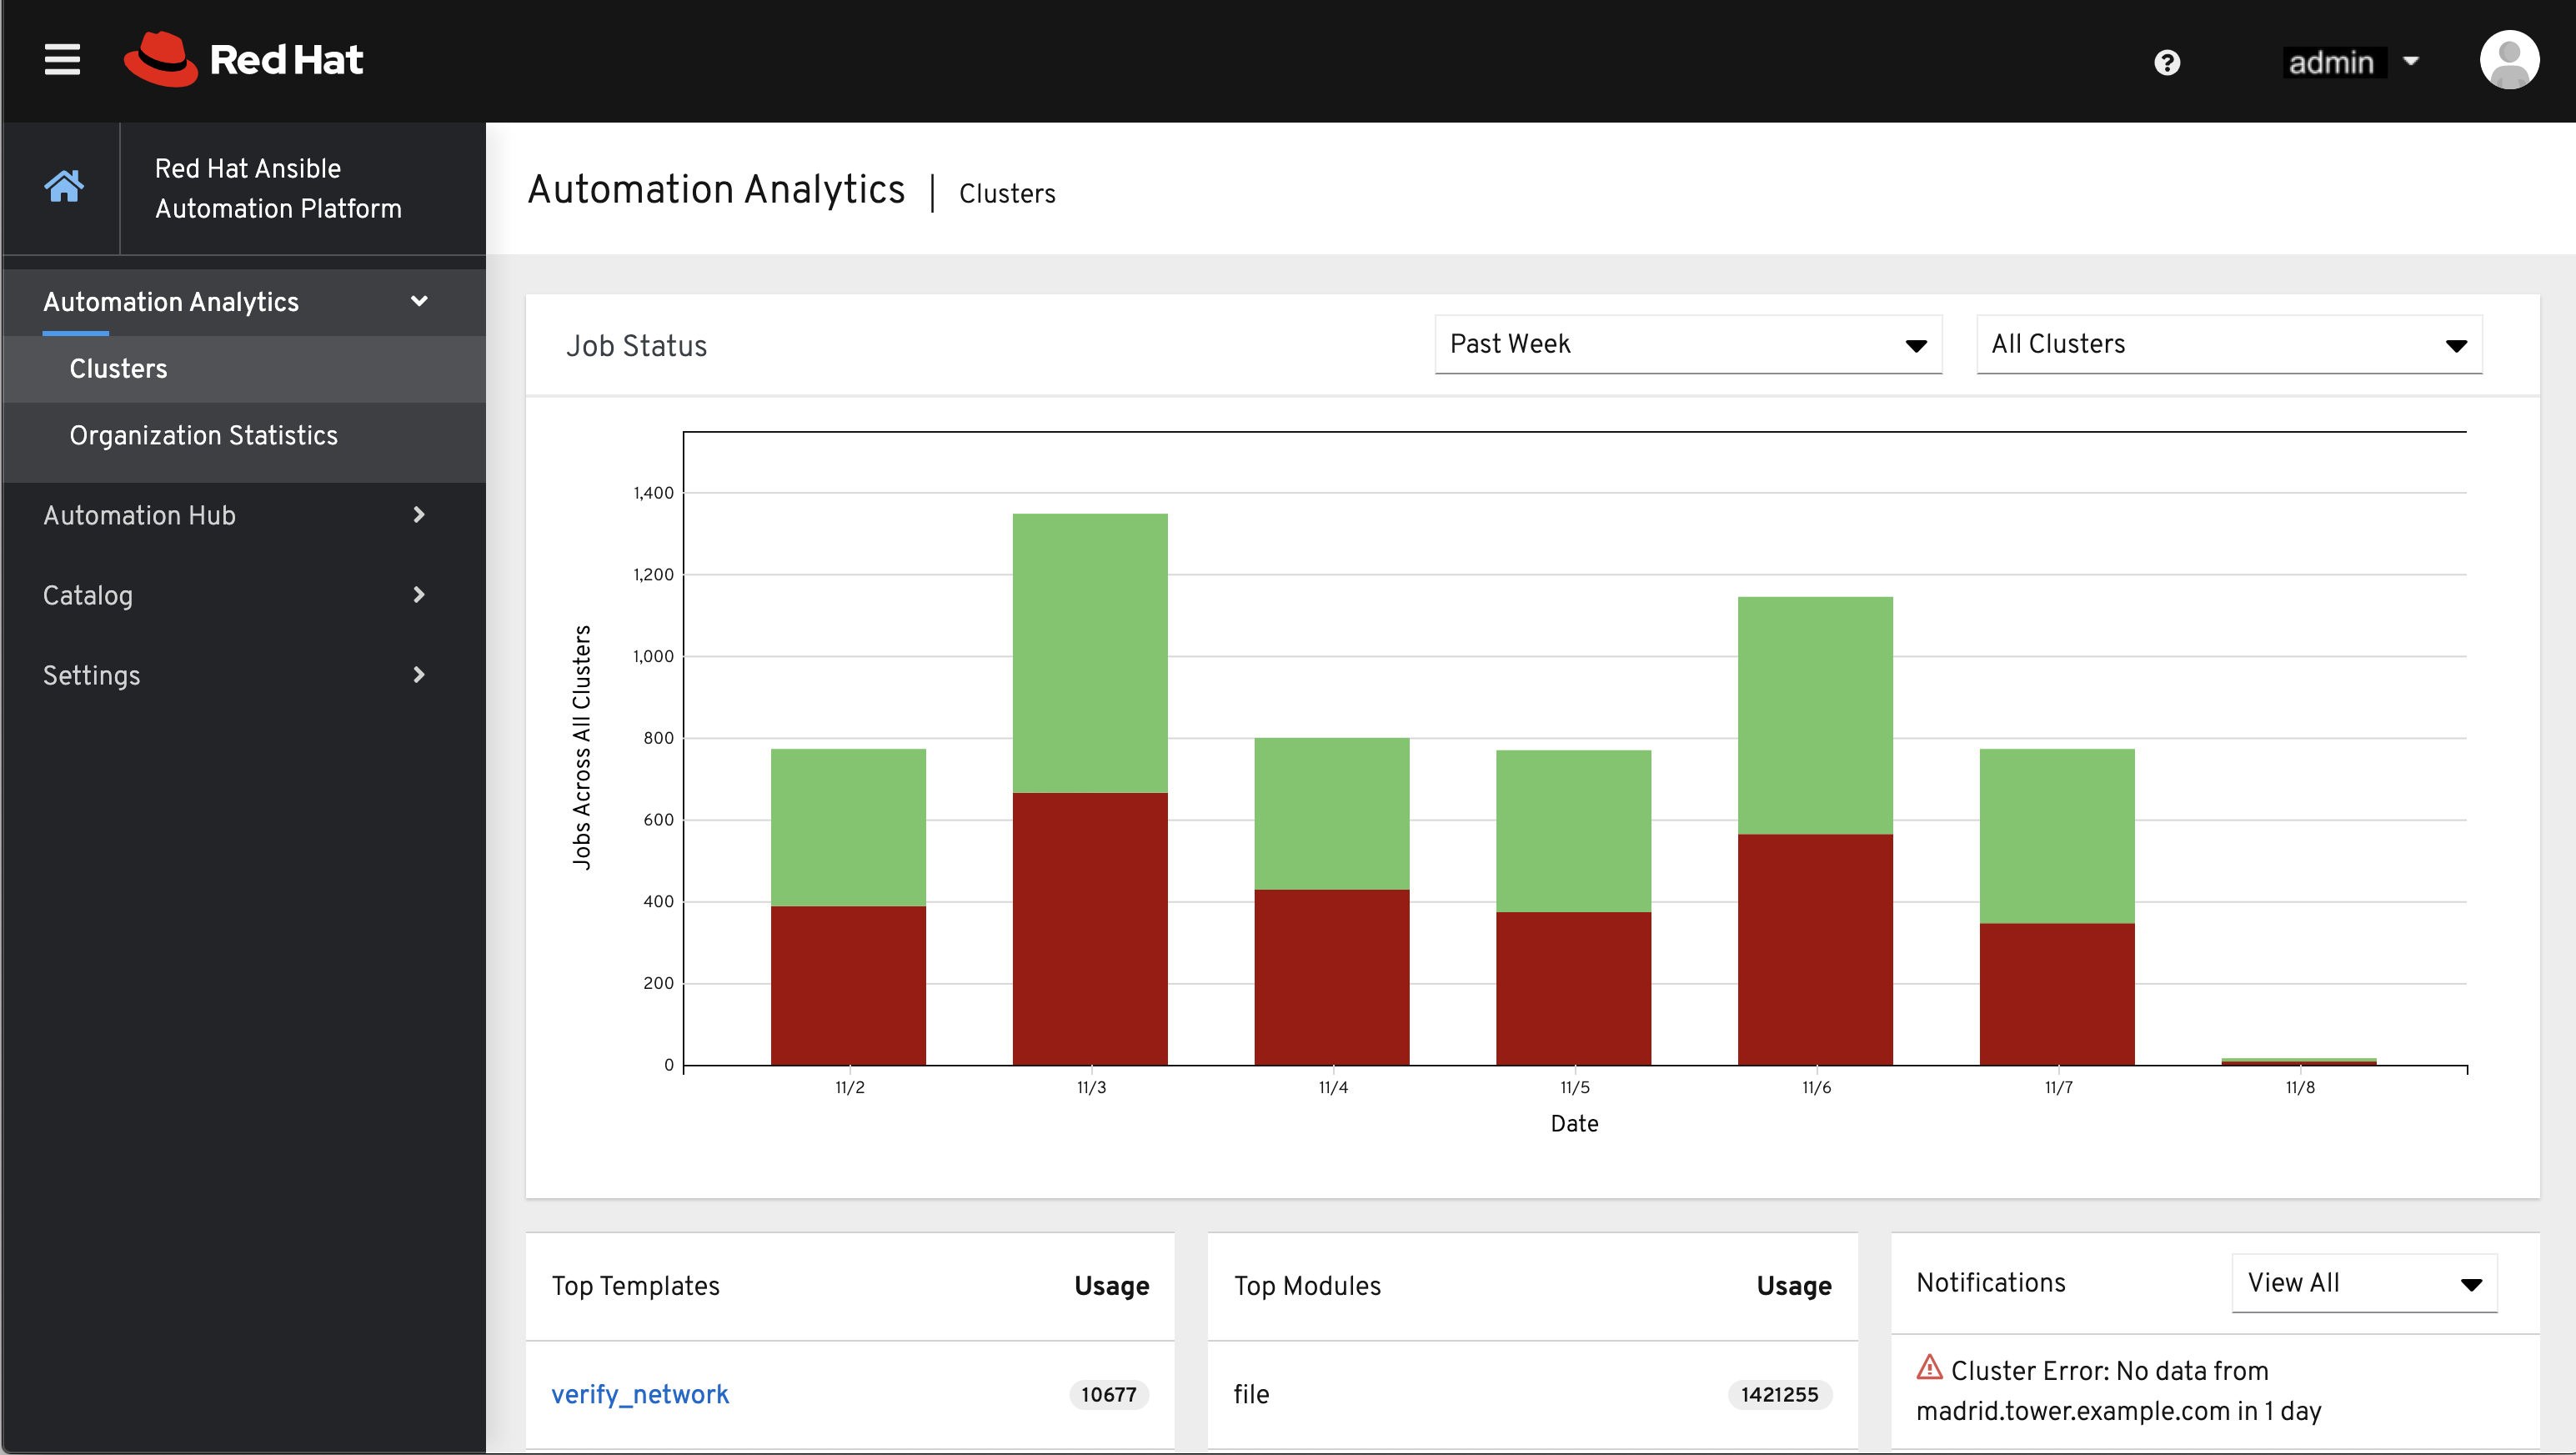
The Clusters data is the default view. This graph represents the number of job runs across all Tower clusters over a period of time. The example above shows a span of a week in a stacked bar-style chart that is organized by the number of jobs that ran successfully (in green) and jobs that failed (in red).
Alternatively, you can select a single cluster to view its job status information.
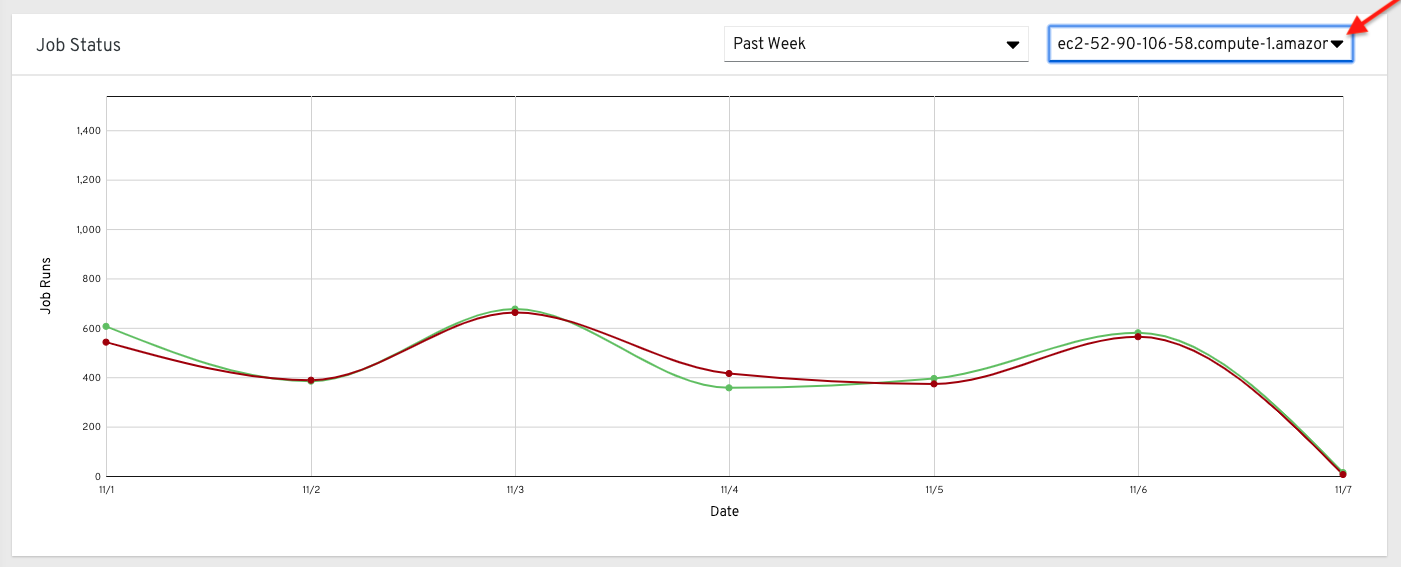
This multi-line chart represents the number of job runs for a single Tower cluster for a specified period of time. The example here shows a span of a week, organized by the number of successfully running jobs (in green) and jobs that failed (in red). You can specify the number of successful and failed job runs for a selected cluster over a span of one week, two weeks, and monthly increments.
Click Organization Statistics from the left navigation pane to view information for the following:
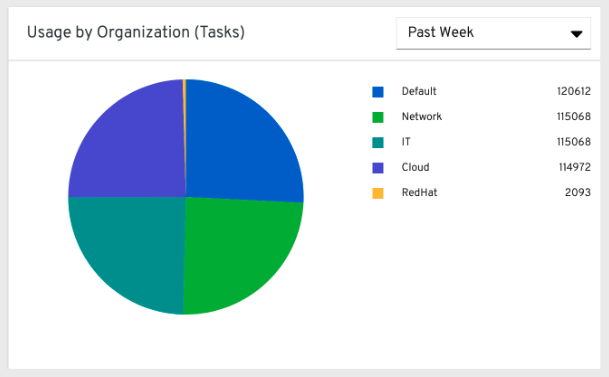
29.1.1. Usage by organization
This pie chart represents the number of tasks ran inside all jobs by a particular organization.
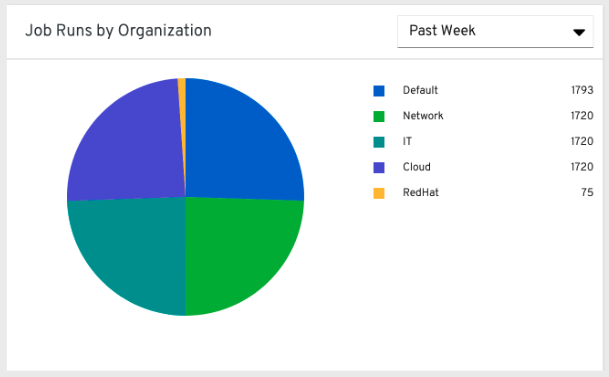
29.1.2. Job runs by organization
This pie chart represents Tower usage across all Tower clusters by organization, which is calculated by the number of jobs run by that organization.
29.1.3. Organization status
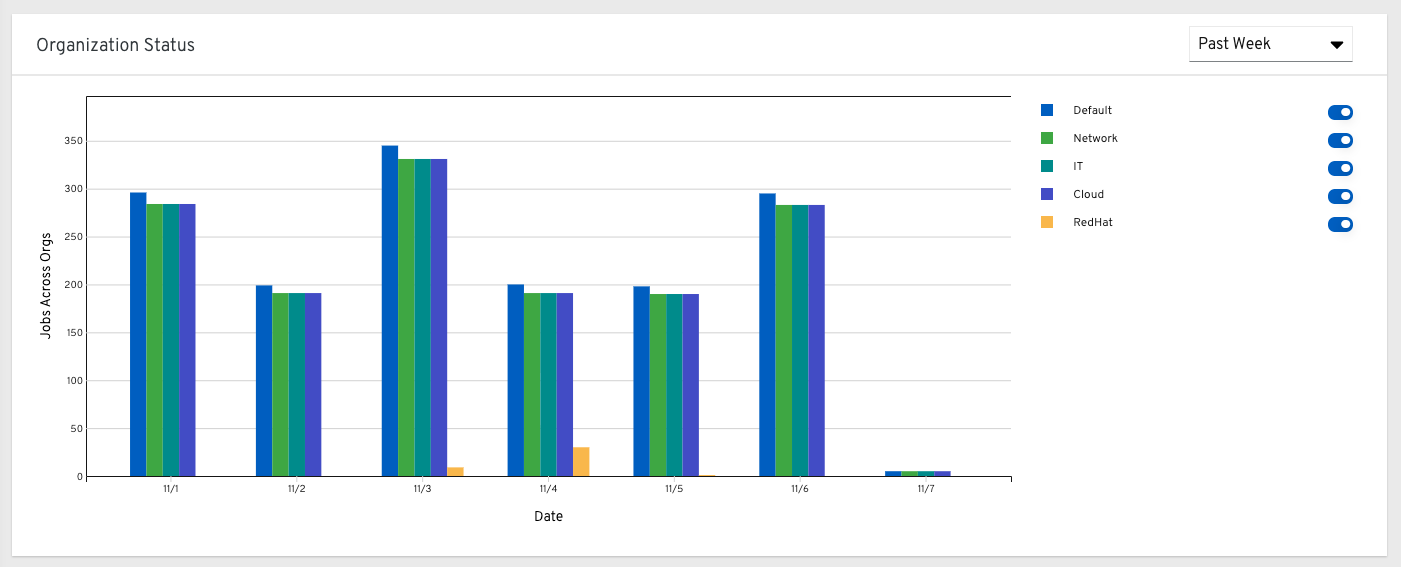
This bar chart represents Tower usage by organization and date, which is calculated by the number of jobs run by that organization on a particular date. Alternatively, you can specify to show the number of job runs per organization in one week, two weeks, and monthly increments.
