18. Controller Configuration
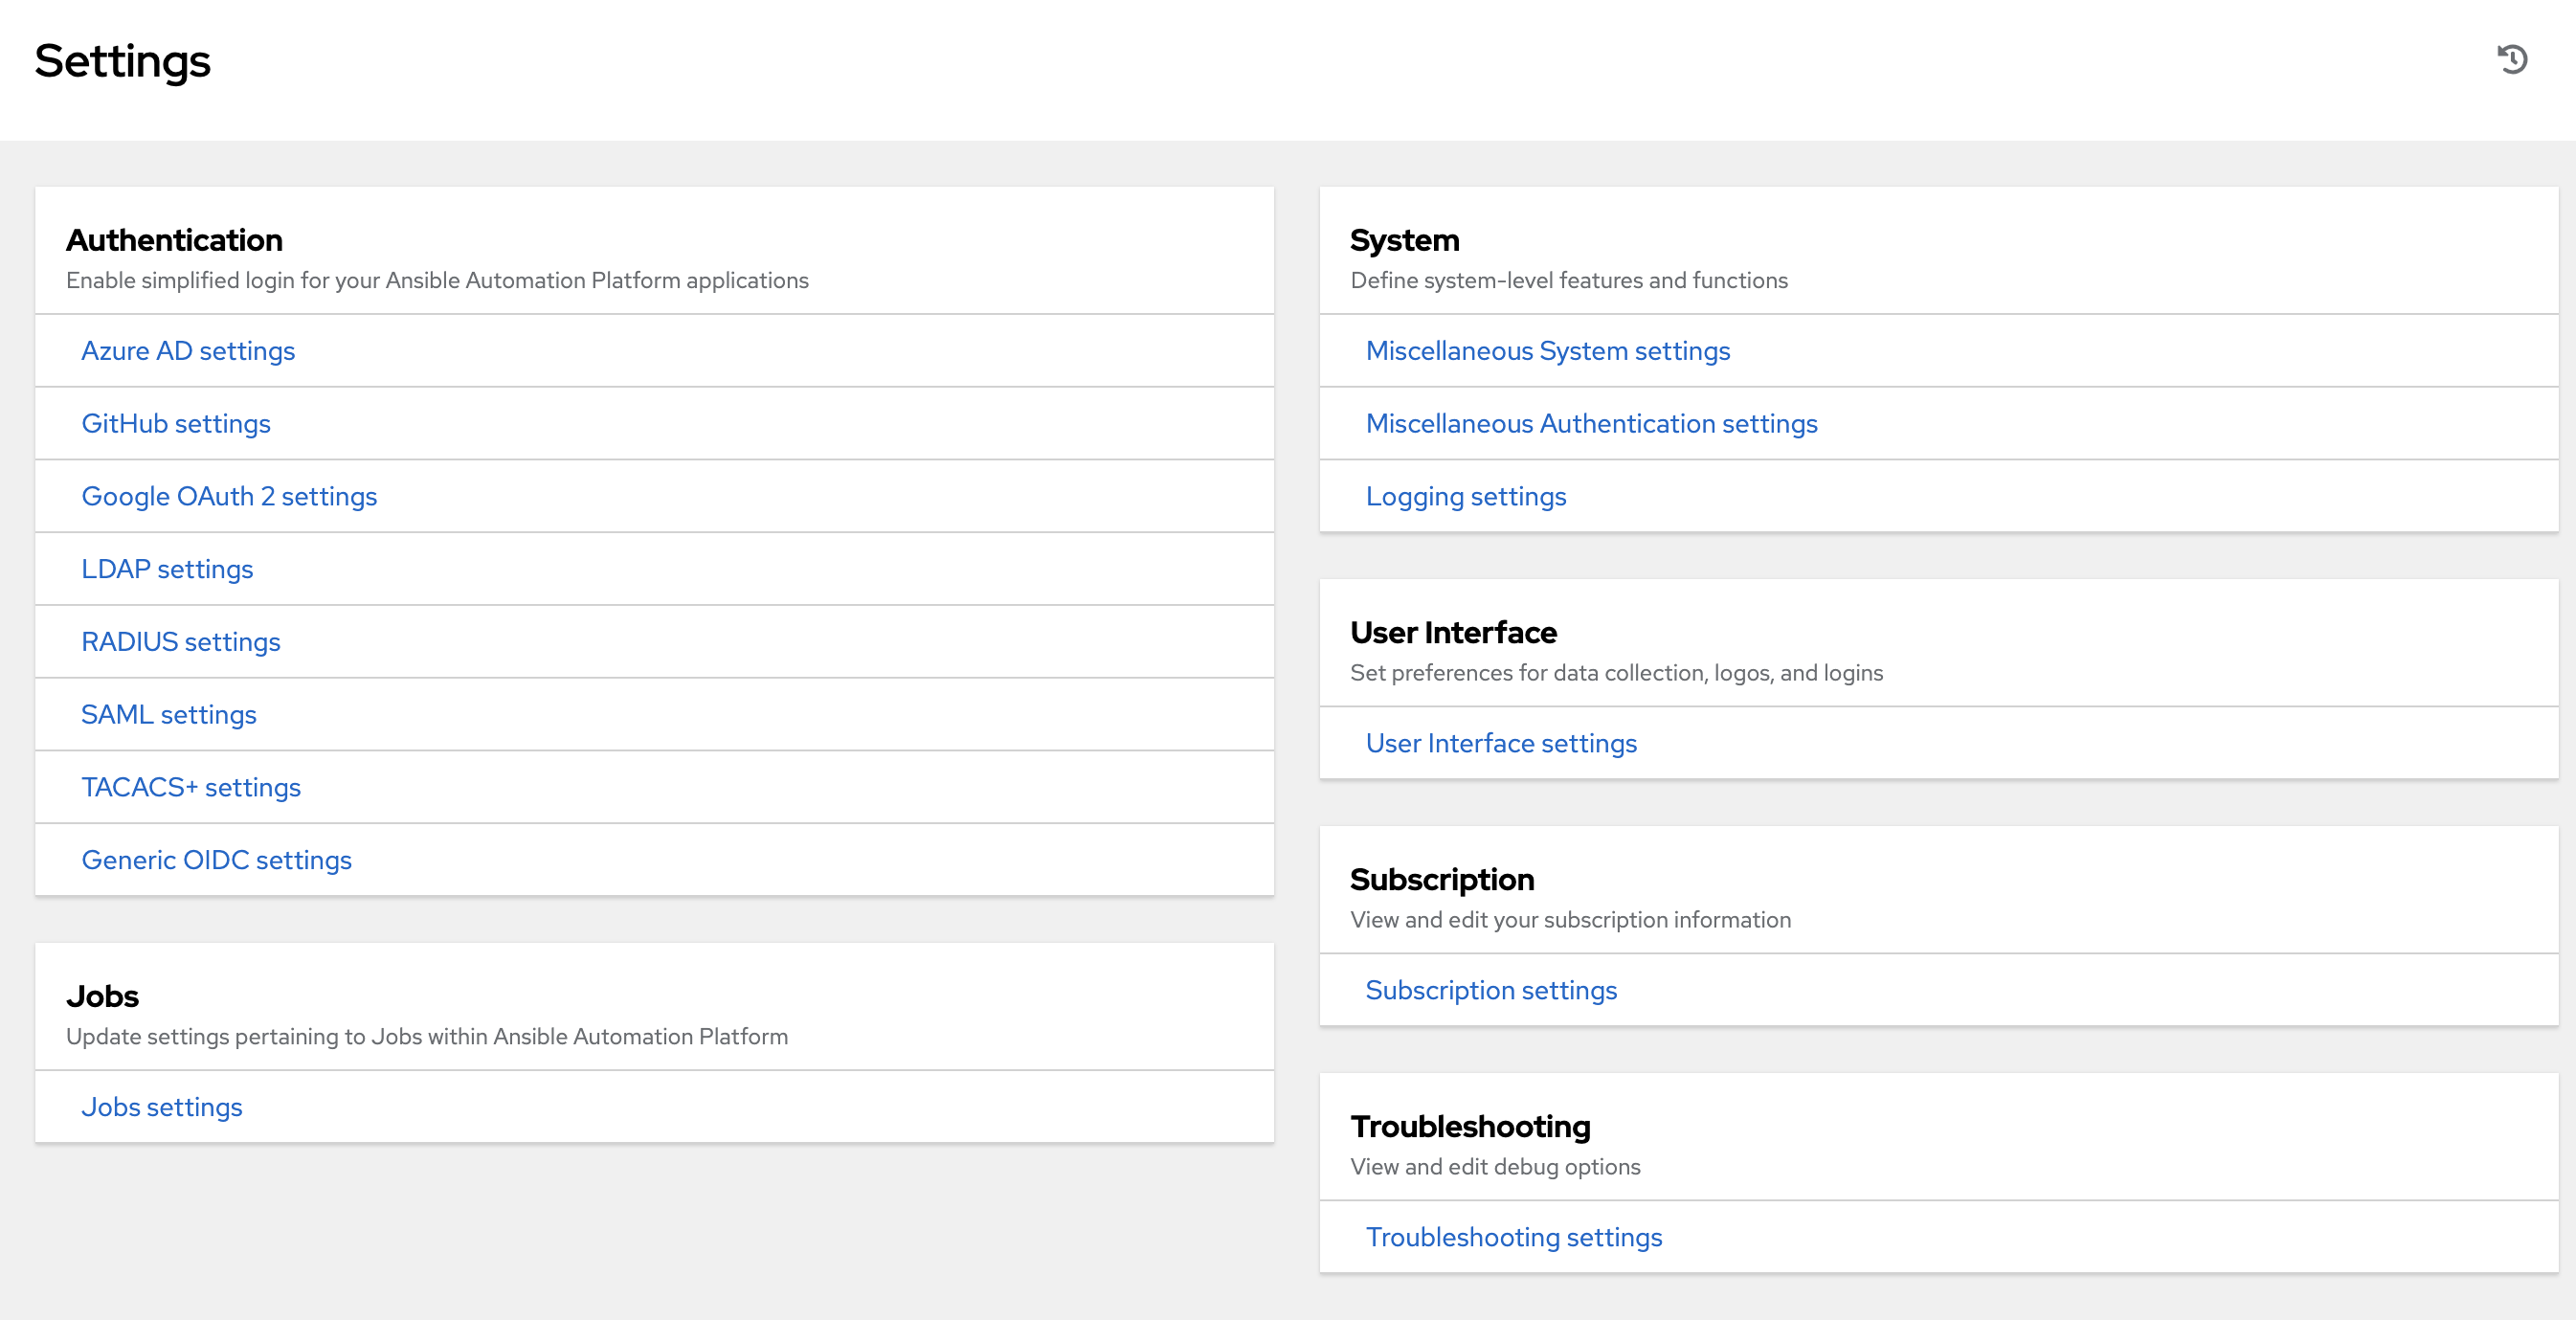
You can configure various controller settings within the Settings screen in the following tabs:
Each tab contains fields with a Reset button, allowing you to revert any value entered back to the default value. Reset All allows you to revert all the values to their factory default values.
Save applies changes you make, but it does not exit the edit dialog. To return to the Settings screen, click Settings from the left navigation bar or use the breadcrumbs at the top of the current view.
18.1. Authentication
Through the controller user interface, you can set up a simplified login through various authentication types: GitHub, Google, LDAP, RADIUS, and SAML. After you create and register your developer application with the appropriate service, you can set up authorizations for them.
From the left navigation bar, click Settings.
The left side of the Settings window is a set of configurable Authentication settings. Select from the following options:
Different authentication types require you to enter different information. Be sure to include all the information as required.
Click Save to apply the settings or Cancel to abandon the changes.
18.2. Jobs
The Jobs tab allows you to configure the types of modules that are allowed to be used by the controller's Ad Hoc Commands feature, set limits on the number of jobs that can be scheduled, define their output size, and other details pertaining to working with Jobs in the controller.
From the left navigation bar, click Settings from the left navigation bar and select Jobs settings from the Settings screen.
Set the configurable options from the fields provided. Click the tooltip
 icon next to the field that you need additional information or details about. Refer to the Ansible Galaxy Support section for details about configuring Galaxy settings.
注釈
The values for all the timeouts are in seconds.
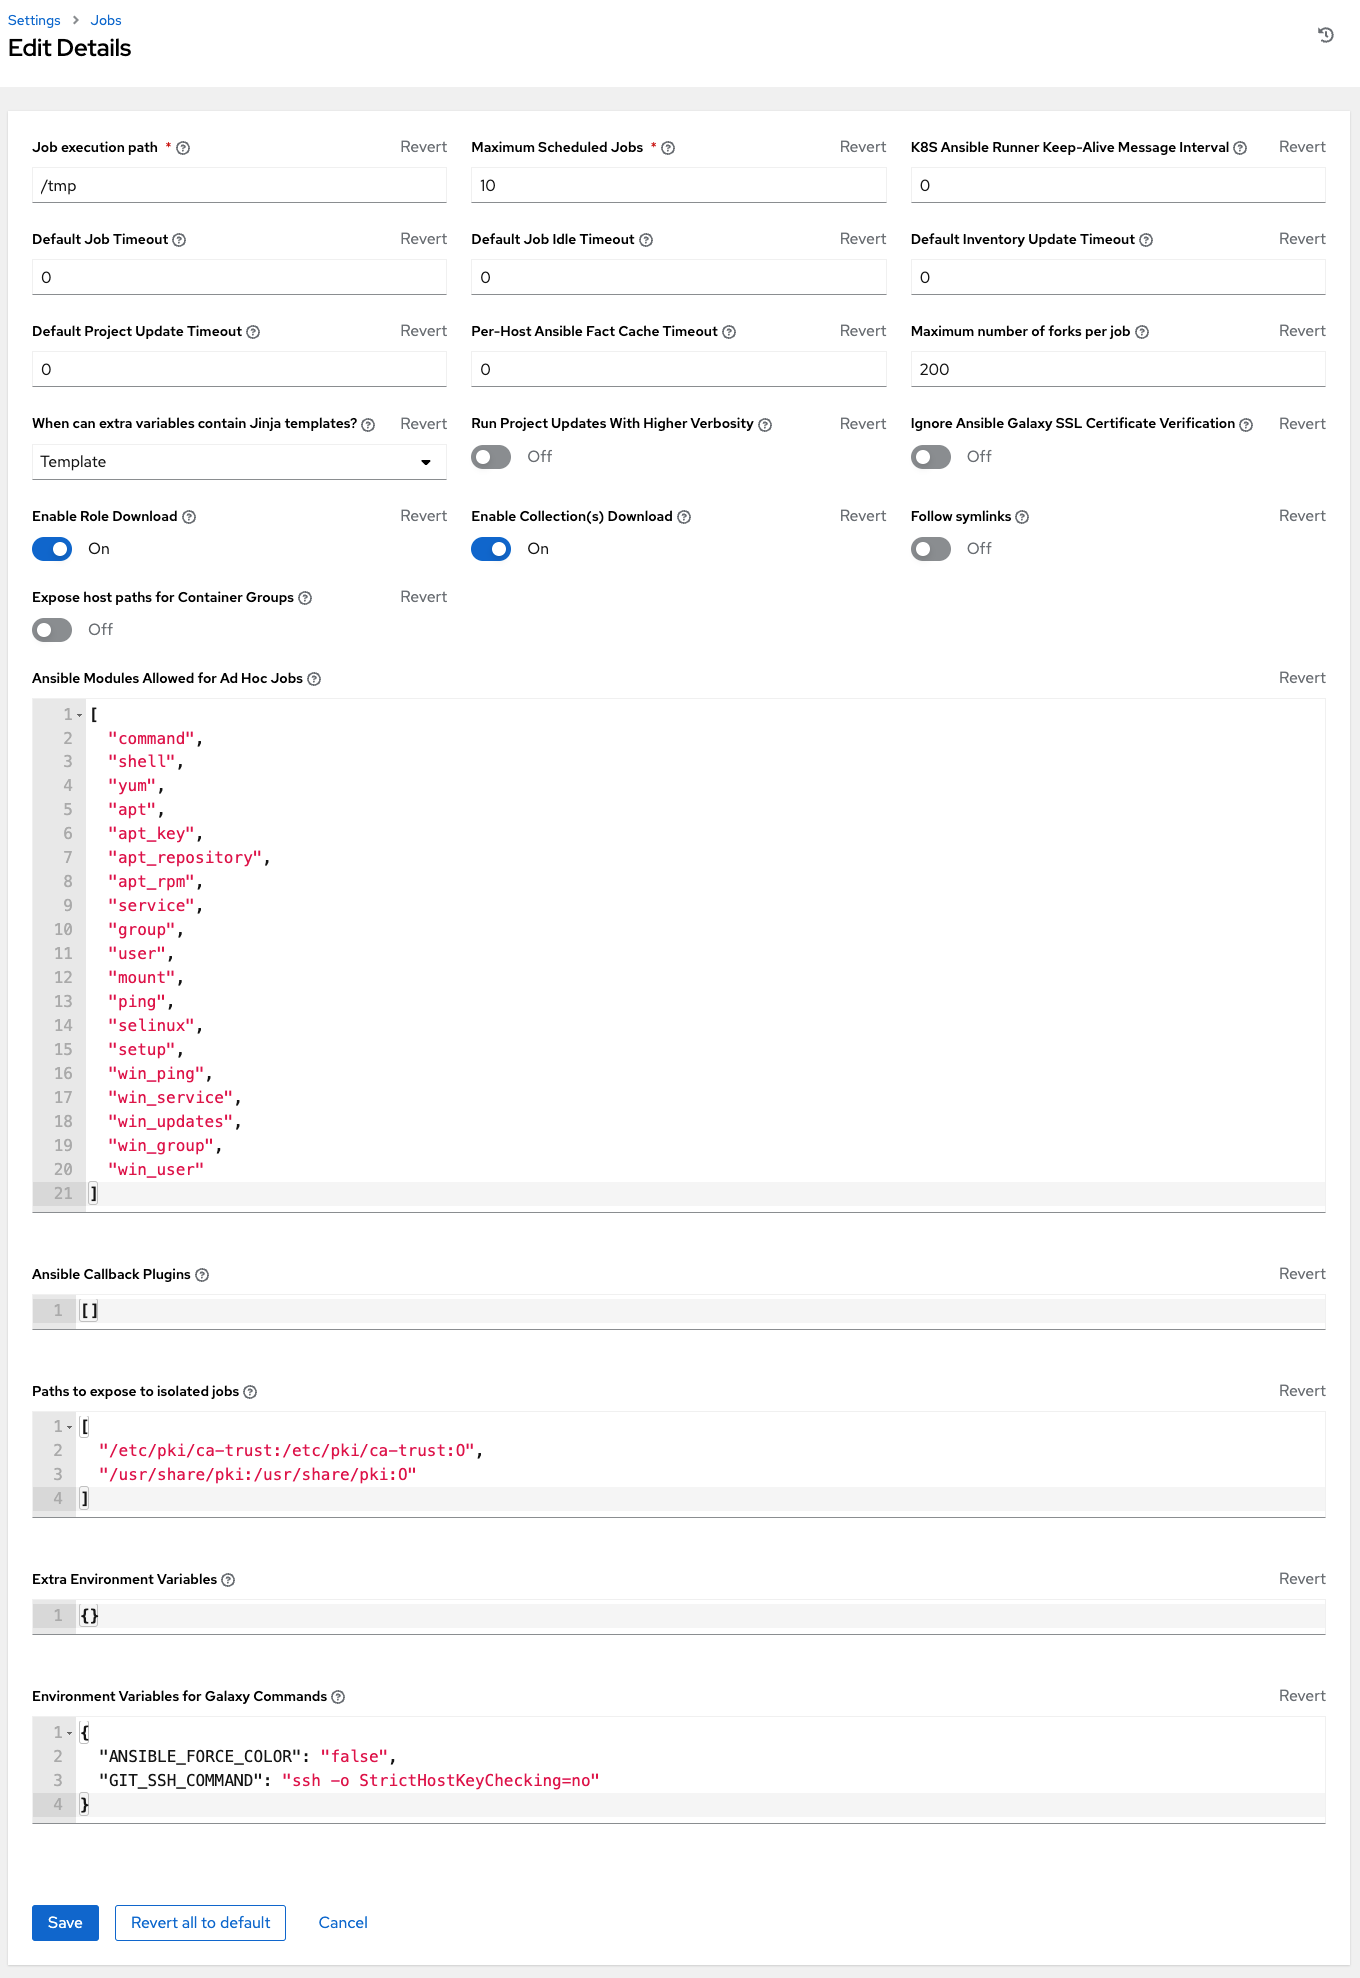
Click Save to apply the settings or Cancel to abandon the changes.
18.3. System
The System tab allows you to define the base URL for the controller host, configure alerts, enable activity capturing, control visibility of users, enable certain controller features and functionality through a license file, and configure logging aggregation options.
From the left navigation bar, click Settings.
The right side of the Settings window is a set of configurable System settings. Select from the following options:
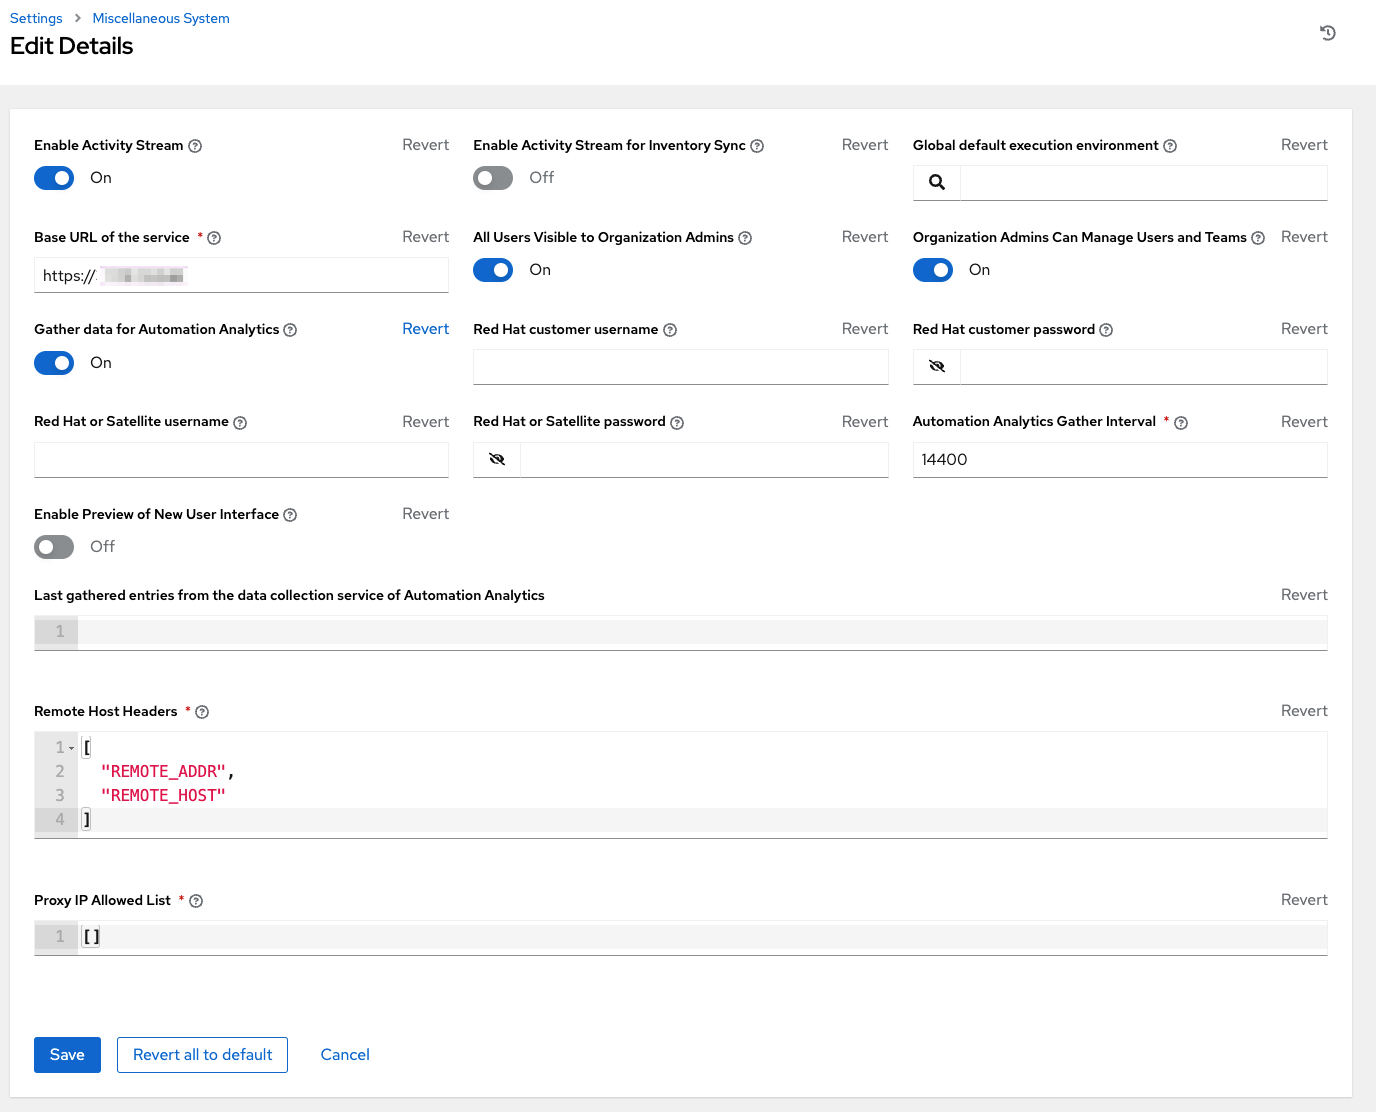
Miscellaneous System settings: enable activity streams, specify the default execution environment, define the base URL for the controller host, enable controller administration alerts, set user visibility, define analytics, specify usernames and passwords, and configure proxies.
Miscellaneous Authentication settings: configure options associated with authentication methods (built-in or SSO), sessions (timeout, number of sessions logged in, tokens), and social authentication mapping.
Logging settings: configure logging options based on the type you choose:
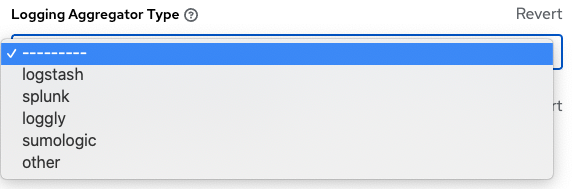
For more information about each of the logging aggregation types, refer to the Controller Logging and Aggregation section of the Automation Controller Administration Guide.
Set the configurable options from the fields provided. Click the tooltip
icon next to the field that you need additional information or details about. Below is an example of the System settings window.
注釈
The Allow External Users to Create Oauth2 Tokens setting is disabled by default. This ensures external users cannot create their own tokens. If you enable then disable it, any tokens created by external users in the meantime will still exist, and are not automatically revoked.
Click Save to apply the settings or Cancel to abandon the changes.
18.4. User Interface
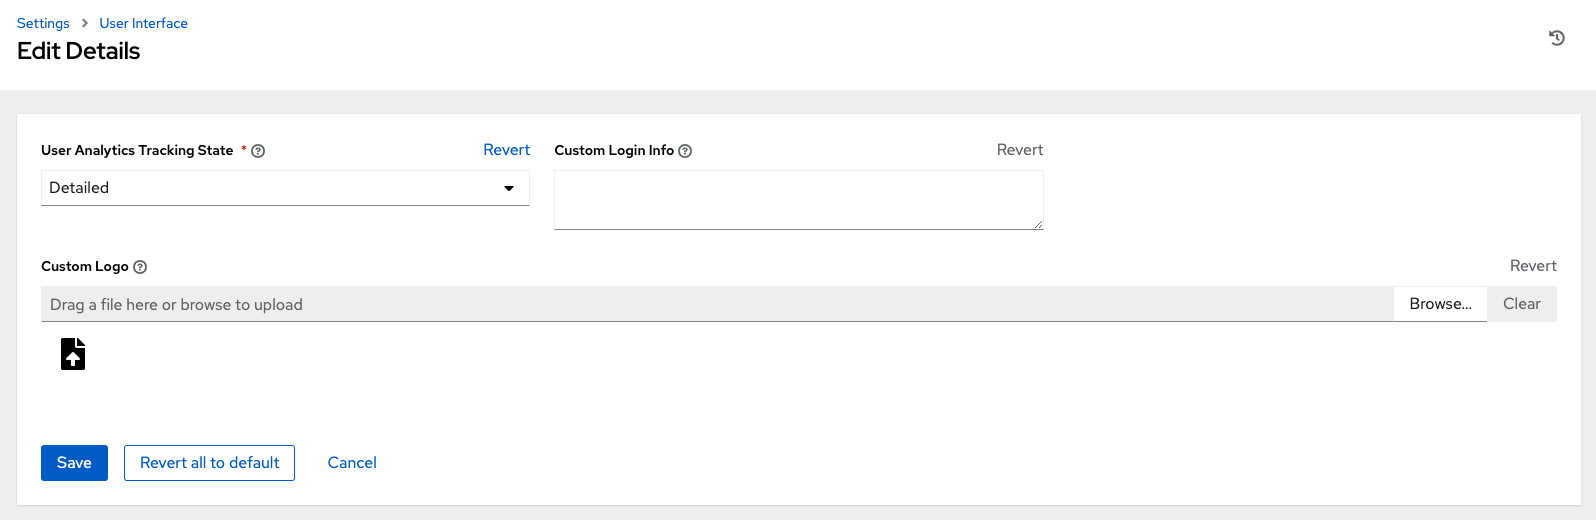
The User Interface tab allows you to set controller analytics settings, as well as configure custom logos and login messages.
Access the User Interface settings by clicking Settings from the left navigation bar and select User Interface settings from the Settings screen. Click Edit to configure your preferences.
18.4.1. Usability Analytics and Data Collection
Usability data collection is included with automation controller to collect data to better understand how controller users specifically interact with it, to help enhance future releases, and to continue streamlining your user experience.
Only users installing a trial of Red Hat Ansible Automation Platform or a fresh installation of automation controller are opted-in for this data collection.
Automation controller collects user data automatically to help improve the product. You can opt out or control the way the controller collects data by setting your participation level in the User Interface settings in the Settings menu.
Click Settings from the left navigation bar and select User Interface settings.
Click Edit.
Select the desired level of data collection from the User Analytics Tracking State drop-down list:
Off: Prevents any data collection.
Anonymous: Enables data collection without your specific user data.
Detailed: Enables data collection including your specific user data.
Click Save to apply the settings or Cancel to abandon the changes.
For more information, see the Red Hat privacy policy at https://www.redhat.com/en/about/privacy-policy.
18.4.2. Custom Logos and Images
automation controller supports the use of a custom logo. You can add a custom logo by uploading an image; and supply a custom login message from the User Interface settings of the Settings menu.
For the custom logo to look its best, use a .png file with a transparent background. GIF, PNG, and JPEG formats are supported.
If needed, you can add specific information (such as a legal notice or a disclaimer) to a text box in the login modal by adding it to the Custom Login Info text field.
For example, if you uploaded a specific logo, and added the following text:
The Tower login dialog would look like this:
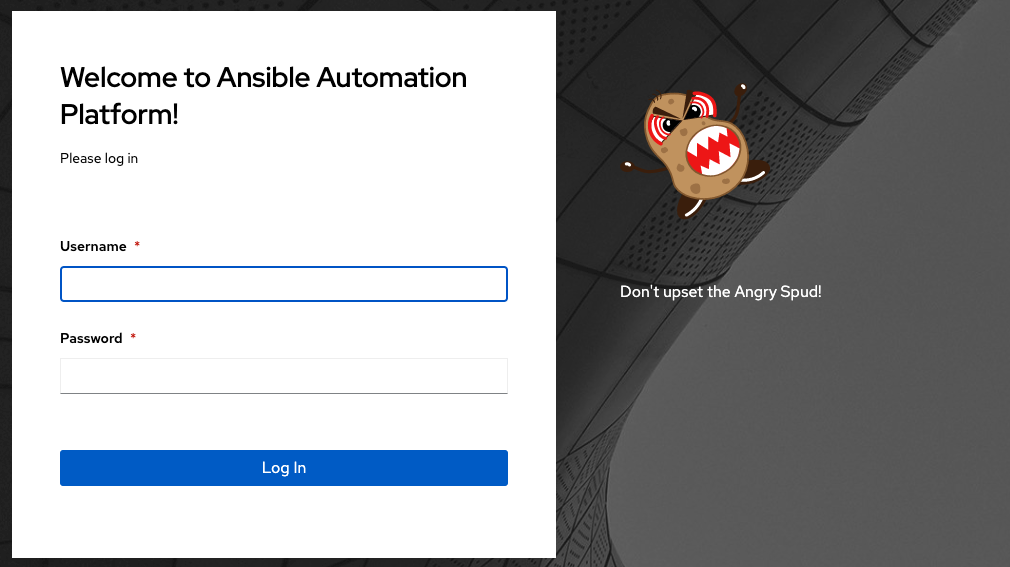
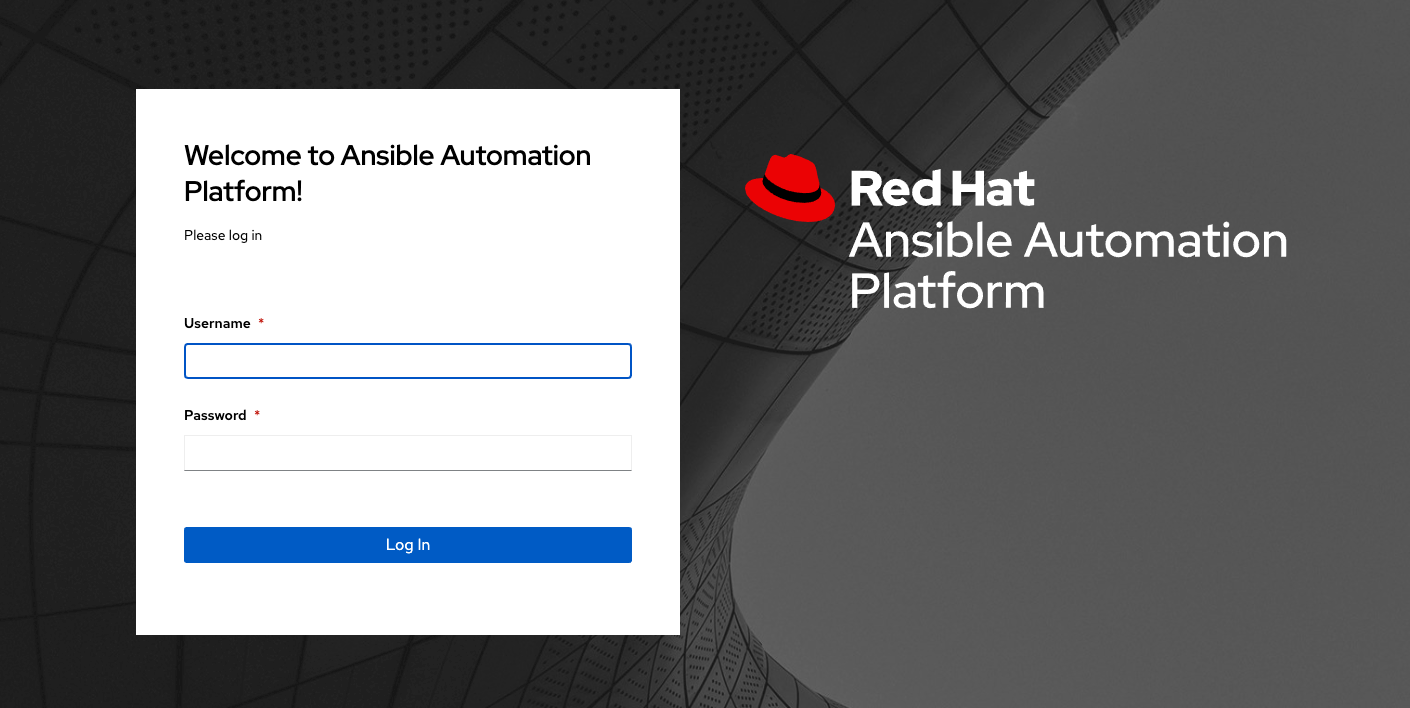
Selecting Revert will result in the appearance of the standard automation controller logo.
18.5. Subscription
Available subscriptions or a subscription manifest authorize the use of the automation controller. To obtain your automation controller subscription, you can either:
Provide your Red Hat or Satellite username and password on the license page.
Obtain a subscriptions manifest from your Subscription Allocations page on the customer portal. See Obtaining a subscriptions manifest in the Automation Controller User Guide for more detail.
If you have a Red Hat Ansible Automation Platform subscription, use your Red Hat customer credentials when you launch the controller to access your subscription information (see instructions below).
If you do not have a Red Hat Ansible Automation Platform subscription, you can request a trial subscription here or click Request Subscription and follow the instructions to request one.
Disconnected environments with Satellite will be able to use the login flow on vm-based installations if they have configured subscription manager on the controller instance to connect to their Satellite instance. Recommended workarounds for disconnected environments without Satellite include [1] downloading a manifest from access.redhat.com in a connected environment, then uploading it to the disconnected controller instance, or [2] connecting to the Internet through a proxy server.
注釈
In order to use a disconnected environment, it is necessary to have a valid automation controller entitlement attached to your Satellite organization's manifest. This can be confirmed by using hammer subscription list \--organization <org_name>.
To understand what is supported with your subscription, see Red Hat Ansible Automation Platform Controller Licensing, Updates, and Support for more information. If you have issues with the subscription you have received, please contact your Sales Account Manager or Red Hat Customer Service at https://access.redhat.com/support/contact/customerService/.
When the controller launches for the first time, the Subscription screen automatically displays.
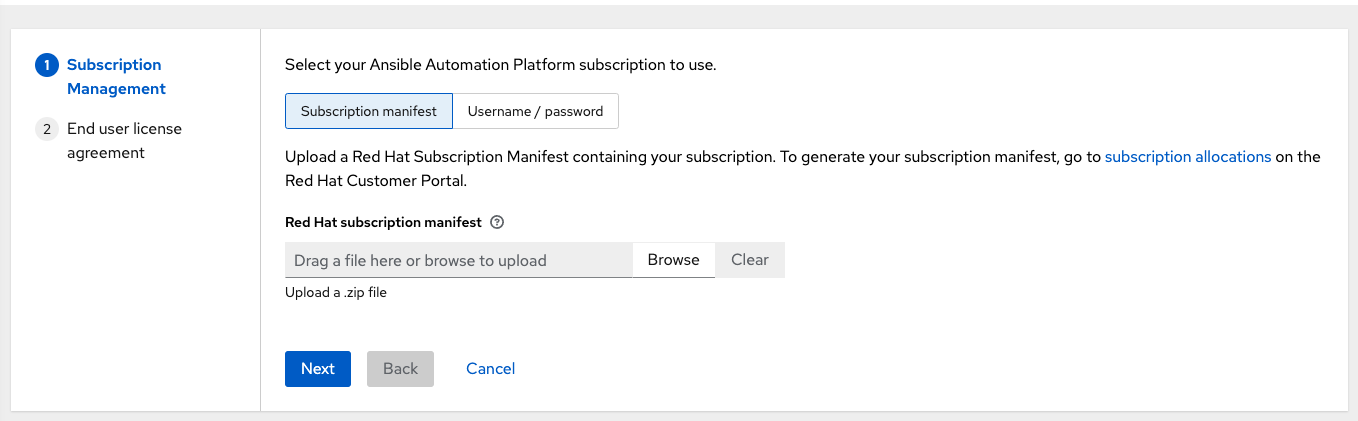
By default, the option to retrieve and import your subscription is to upload a subscription manifest you generate from https://access.redhat.com/management/subscription_allocations. See Obtaining a subscriptions manifest for more detail. Once you have a subscription manifest, you can upload it by browsing to the location where the file is saved (the subscription manifest is the complete .zip file, not its component parts).
注釈
If the Browse button in the subscription manifest option is grayed-out, clear the username and password fields to enable the Browse button.
Alternatively, you can choose the option to enter your Red Hat customer credentials using your username and password. Use your Satellite username/password if your controller cluster nodes are registered to Satellite via Subscription Manager. Once you entered your credentials, click Get Subscriptions.
The subscription metadata is then retrieved from the RHSM/Satellite API, or from the manifest provided.
If it is a subscription manifest, and multiple subscription counts were applied in a single installation, the controller will combine the counts but use the earliest expiration date as the expiry (at which point you will need to refresh your subscription).
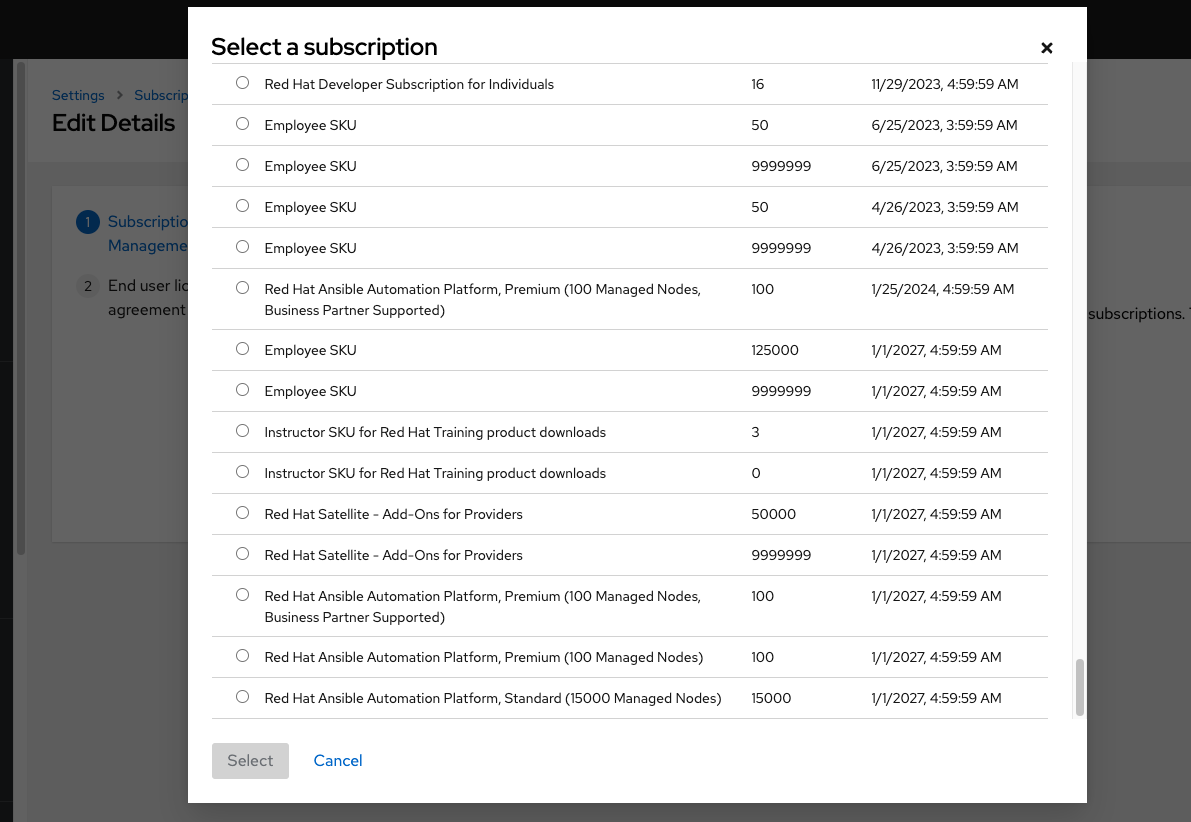
If you entered your credential information (username/password), the controller retrieves your configured subscription service. Then it prompts you to choose the subscription you want to run (the example below shows multiple subscriptions) and entitles the controller with that metadata. You can log in over time and retrieve new subscriptions if you have renewed.
注釈
When your subscription expires (you can check this in the Subscription details of the Subscription settings window), you will need to renew it in the controller by one of these two methods.
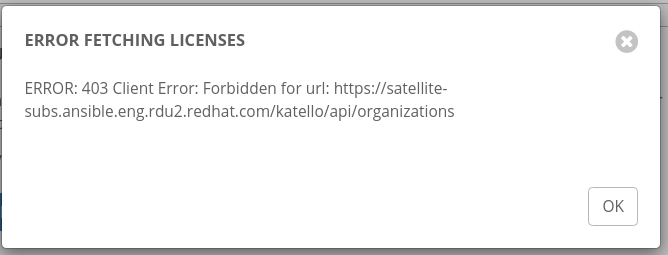
If you encounter the following error message, you will need the proper permissions required for the Satellite user with which the controller admin uses to apply a subscription.
The Satellite username/password is used to query the Satellite API for existing subscriptions. From the Satellite API, the automation controller gets back some metadata about those subscriptions, then filter through to find valid subscriptions that you could apply, which are then displayed as valid subscription options in the UI.
The following Satellite roles grant proper access:
Custom with
view_subscriptionsandview_organizationsfilterViewer
Administrator
Organization Admin
Manager
As the Custom role is the most restrictive of these, this is the recommend role to use for your controller integration. Refer to the Satellite documentation on managing users and roles for more detail.
注釈
The System Administrator role is not equivalent to the Administrator user checkbox, and will not provide sufficient permissions to access the subscriptions API page.
Click Next to proceed to Tracking and Insights. Tracking and insights collect data to help Red Hat improve the product by delivering you a much better user experience. For more information about data collection, refer to Usability Analytics and Data Collection. This option is checked by default, but you may opt out of any of the following:
User analytics collects data from the controller User Interface.
Insights Analytics provides a high level analysis of your automation with automation controller, which is used to help you identify trends and anomalous use of the controller. For opt-in of Automation Analytics to have any effect, your instance of automation controller must be running on Red Hat Enterprise Linux. See instructions described in the Automation Analytics section. If you select to opt-in for this option, the screen expands and prompts for a username and password to enable Insights, if applicable.
注釈
You may change your analytics data collection preferences at any time, as described in the Usability Analytics and Data Collection section.
After you have specified your tracking and insights preferences, click Next to proceed to the End User Agreement.
Review and check the I agree to the End User License Agreement checkbox and click Submit.
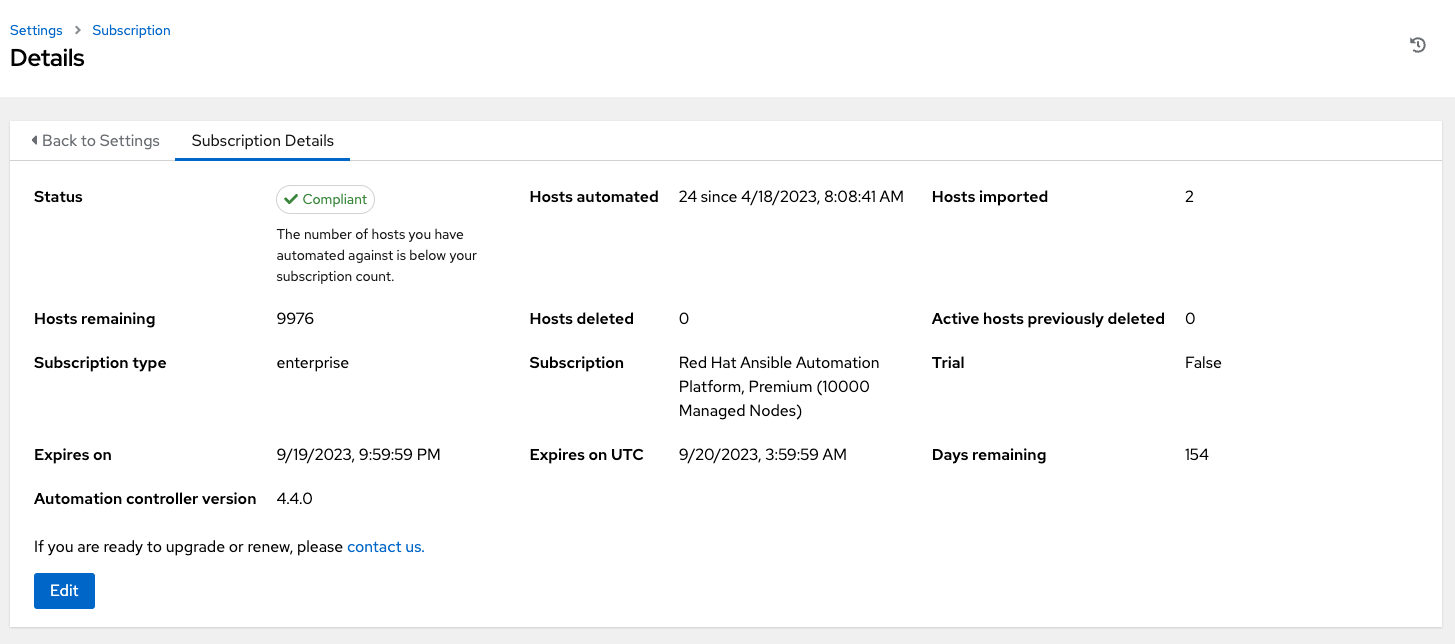
Once your subscription has been accepted, the controller briefly displays the subscription details and navigates you to the Dashboard of the automation controller interface. For later reference, you can return to this screen by clicking Settings from the left navigation bar and select Subscription settings from the Subscription option.
18.5.1. Subscription compliance
Using Ansible in environments where node counts are frequently changing (CI environments, public cloud environments, etc) can be a challenge to keep track, so Ansible Automation Platform automatically keeps count of node usage properly to ensure they are counted accurately, not double-counted, or only count nodes that were automated first, etc. Often, these instances are thought of as ephemeral, meaning they exist for some unit of time, e.g. an hour or so, then are deleted. Refer to the blog, Subscription and Host Metric Changes in Ansible Automation Platform 2.4 for details of this concept.
The above blog explains situations on why you would want to delete hosts, (e.g., ephemeral), and walks through what is and is not a deleted host that reappears. This allows you to search on keywords like decommissioned as well as, how do I “decommission” a host? The blog also describes what is "going out of compliance" and "going back into compliance" "means to your subscription allowance.
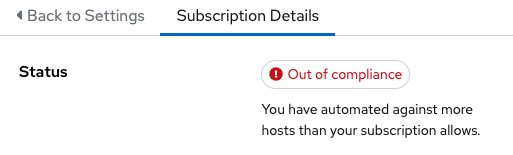
In the automation controller UI, status of  indicates your subscription is in compliance with the number of hosts you have automated within your subscription count. Otherwise, your status will show an Out of Compliance status, indicating you have exceeded the number of hosts in your subscription.
Even if a host is automated in multiple inventories, it will count against your subscription's alloted host count.
Compliance is computed as such:
managed > manifest_limit        =>      non-compliant
managed =< manifest_limit       =>      compliant
Where managed is unique managed hosts without deletions. And manifest_limit is the number of managed hosts in the subscription manifest.
Other important information displayed are:
Hosts automated: Host count automated by the job, which consumes the license count
Hosts imported: Host count considering unique host names across all inventory sources (does not impact hosts remaining)
Hosts remaining: Total host count minus hosts automated
Hosts deleted: Hosts that were deleted, freeing the license capacity
Active hosts previously deleted: Number of hosts now active that were previously deleted
For demonstration purposes, suppose you have a subscription capacity of 10 hosts:
Starting with 9 hosts, 2 hosts were added and 3 hosts were deleted, you now have 8 hosts (compliant)
3 hosts were automated again, now you have 11 hosts, which puts you over the subscription limit of 10 (non-compliant)
If you were to delete host(s), be sure to refresh the subscription details to see the change in count and status
Click Host Metrics from the left navigation menu to view the activity associated with hosts, such as those that have been automated and deleted. Each unique hostname is listed and sorted by the user's preference.
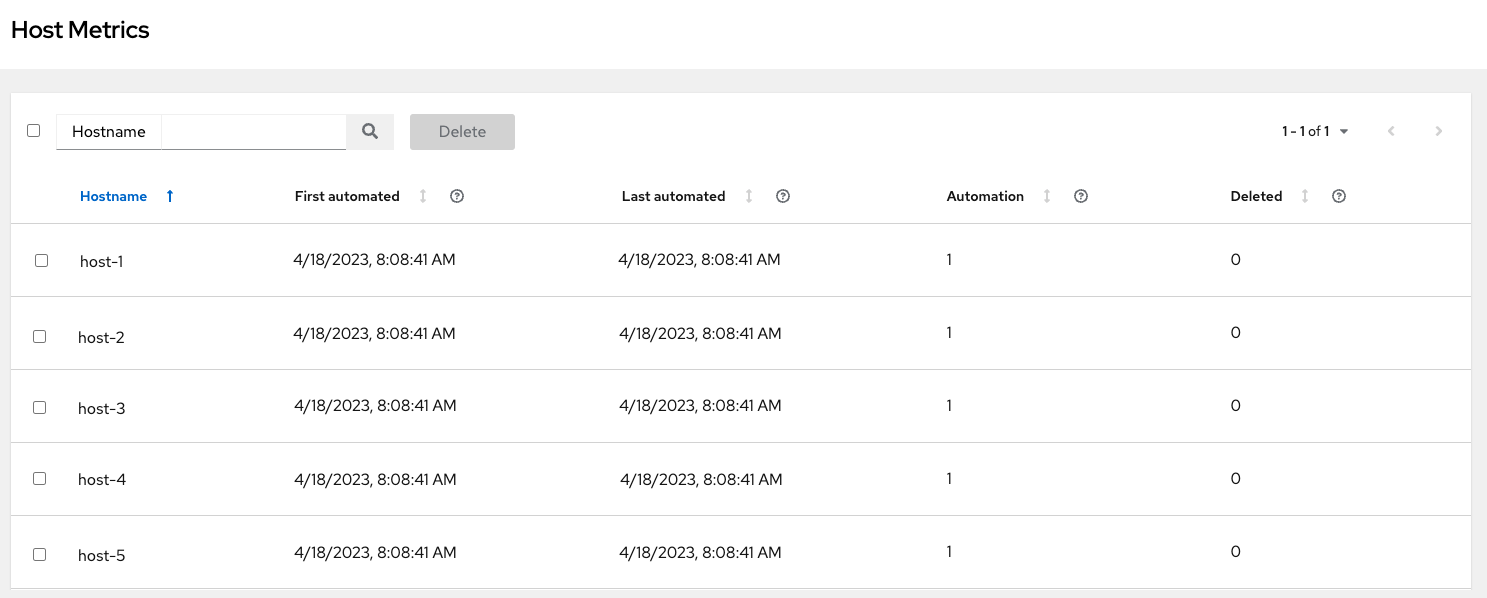
注釈
A scheduled task automatically updates these values on a weekly basis and deletes jobs with hosts that were last automated more than year ago.
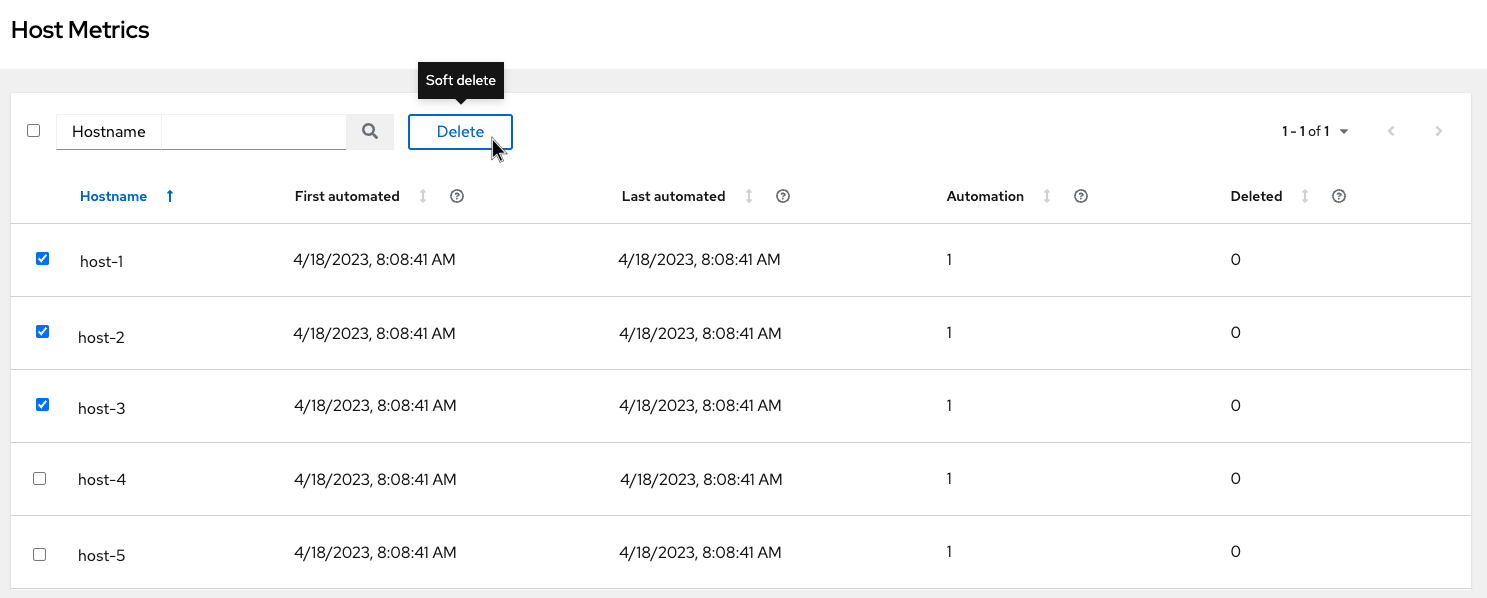
You can delete directly from the Host Metrics view the hosts you no longer want to use by selecting the desired host(s) and clicking Delete. These are soft-deleted, meaning their records are not removed, but are not being used and thereby not counted towards your subscription usage.
18.5.2. Host metrics utilities
The controller provides a way to generate a CSV output of the host metric data and host metric summary through the Command Line Interface (CLI) and to soft delete hosts in bulk through the API.
18.5.2.1. awx-manage utility
The existing awx-manage utility is expanded to support the following options:
awx-manage host_metric --csv
This command produces host metric data, a host metrics summary file, and a cluster info file. To package all the files into a single tarball for ease of distribution and sharing:
awx-manage host_metric --tarball
To specify the number of rows (<n>) to output to each file:
awx-manage host_metric --tarball --rows_per_file <n>
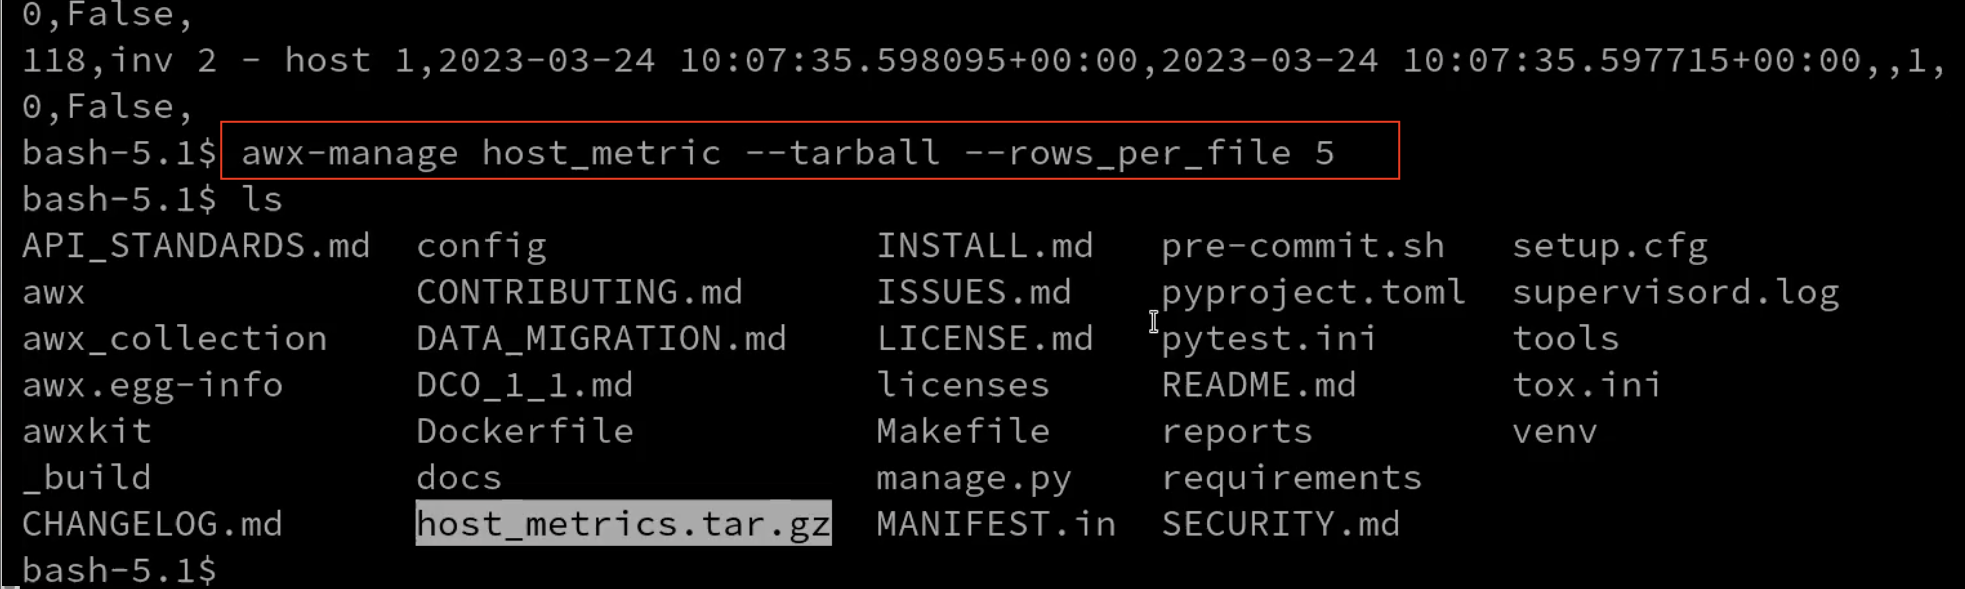
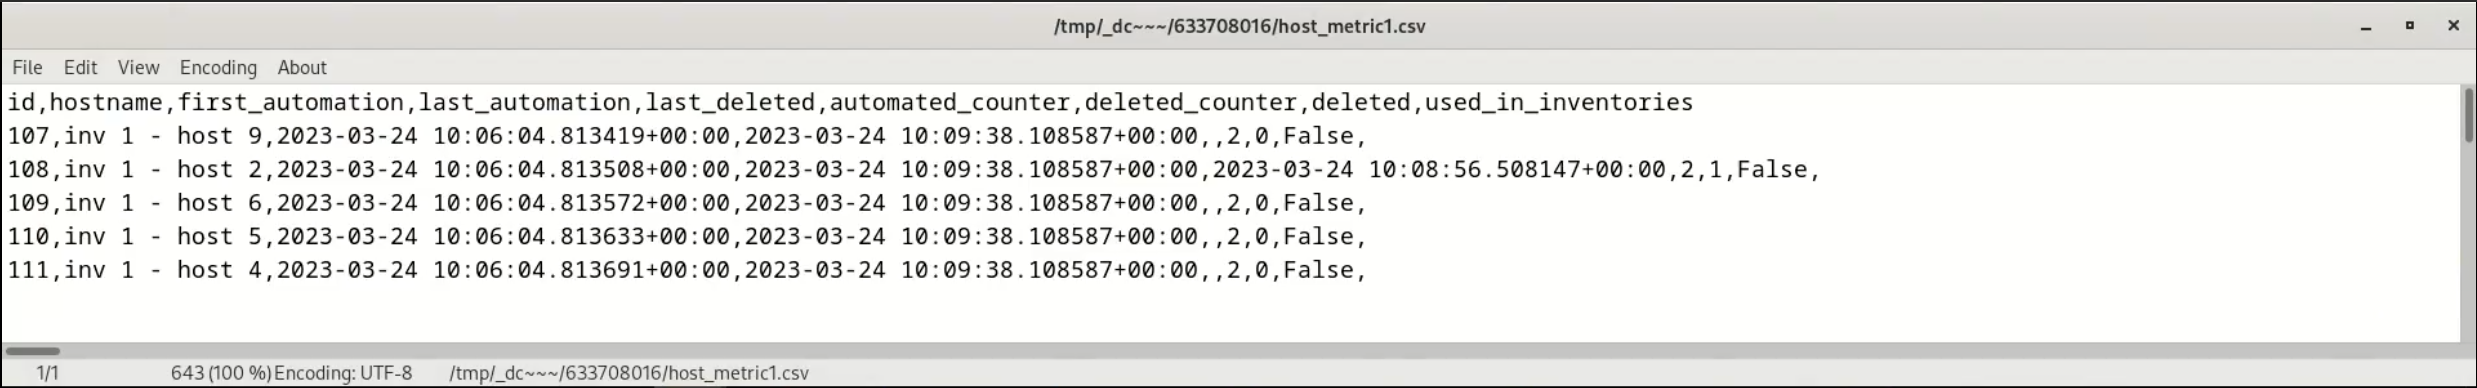
This example specifies 5 rows per file and produces a tarball that contains a config file, the reports, and a host metrics summary file. You can access the tarball and extract it from your local file folder directory.
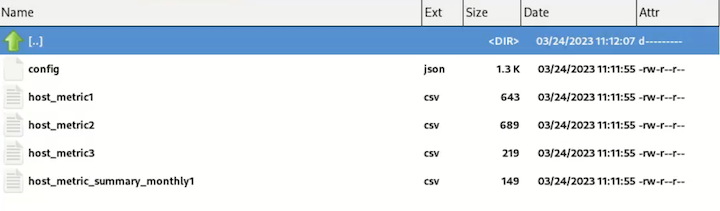
Below is an example of a report produced with 5 rows a file:
Below is an example of a config file:
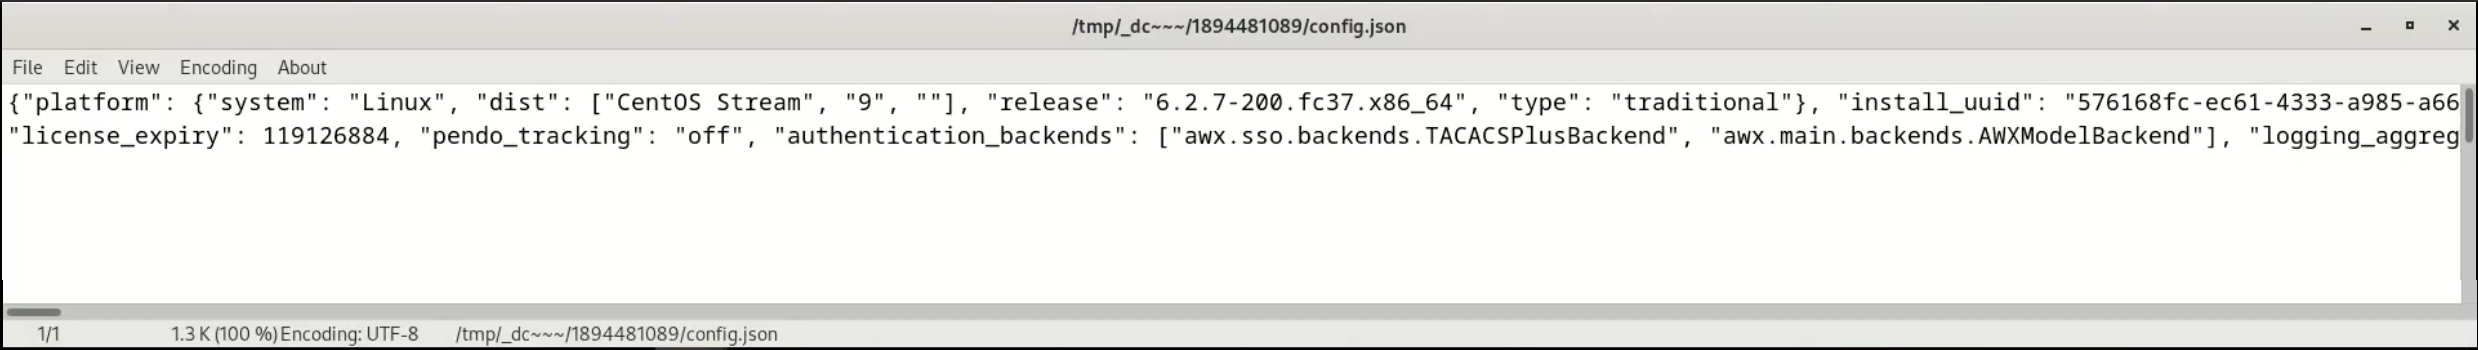
This JSON file is what gets sent to and consumed by Automation Analytics.
The host metrics summary file is blank and is only used as a placeholder for this release.
18.5.2.2. API endpoint functions
The API lists only non-deleted records and are sortable by last_automation and used_in_inventories columns.
Alternative to the UI, you can use the host metric API endpoint, api/v2/host_metric to soft-delete hosts:
api/v2/host_metric <n> DELETE
A monthly scheduled task automatically deletes jobs that uses hosts from the Host Metric table that were last automated more than year ago.