8. Tower Logging and Aggregation
Logging is a standalone feature introduced in Ansible Tower 3.1.0 that provides the capability to send detailed logs to several kinds of 3rd party external log aggregation services. Services connected to this data feed serve as a useful means in gaining insight into Tower usage or technical trends. The data can be used to analyze events in the infrastructure, monitor for anomalies, and correlate events from one service with events in another. The types of data that are most useful to Tower are job fact data, job events/job runs, activity stream data, and log messages. The data is sent in JSON format over a HTTP connection using minimal service-specific tweaks engineered in a custom handler or via an imported library.
The logging aggregator service works with the following monitoring and data analysis systems:
- Splunk
- Loggly
- Sumologic
- Elastic stack (formerly ELK stack) / logstash
8.1. Splunk
To use Splunk, install the Tower Ansible App for Splunk. This simple user interface allows you to specify the data you want to collect. This is done in the HTTP Event Collector of the Splunk® Enterprise user interface.
For details on setting up the HTTP Event Collector, refer to http://docs.splunk.com/Documentation/Splunk/latest/Data/UsetheHTTPEventCollector for further instructions.
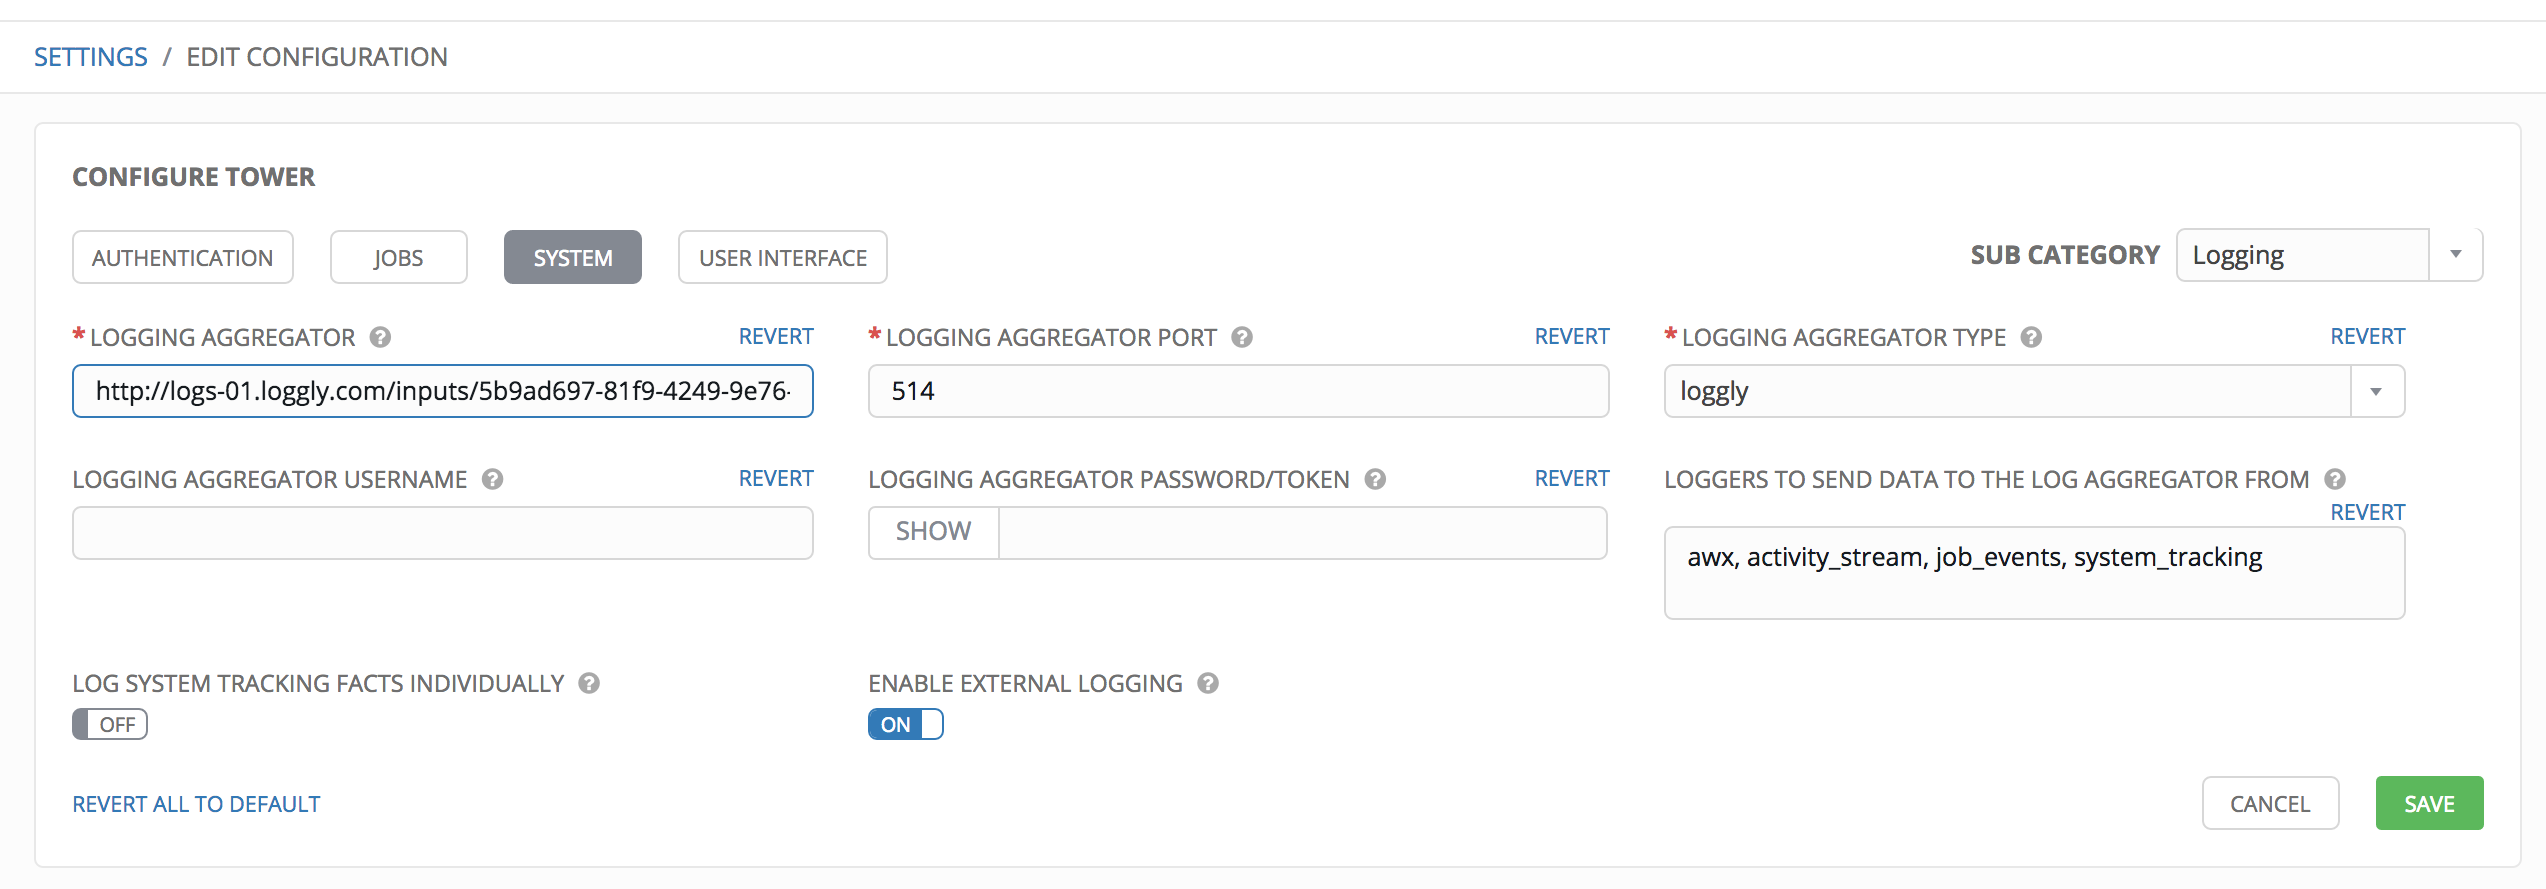
8.2. Loggly
To set up the sending of logs through Loggly’s HTTP endpoint, refer to https://www.loggly.com/docs/http-endpoint/. Loggly uses the URL convention described at http://logs-01.loggly.com/inputs/TOKEN/tag/http/, which is shown inputted in the Tower Edit Configuration window in the example below:
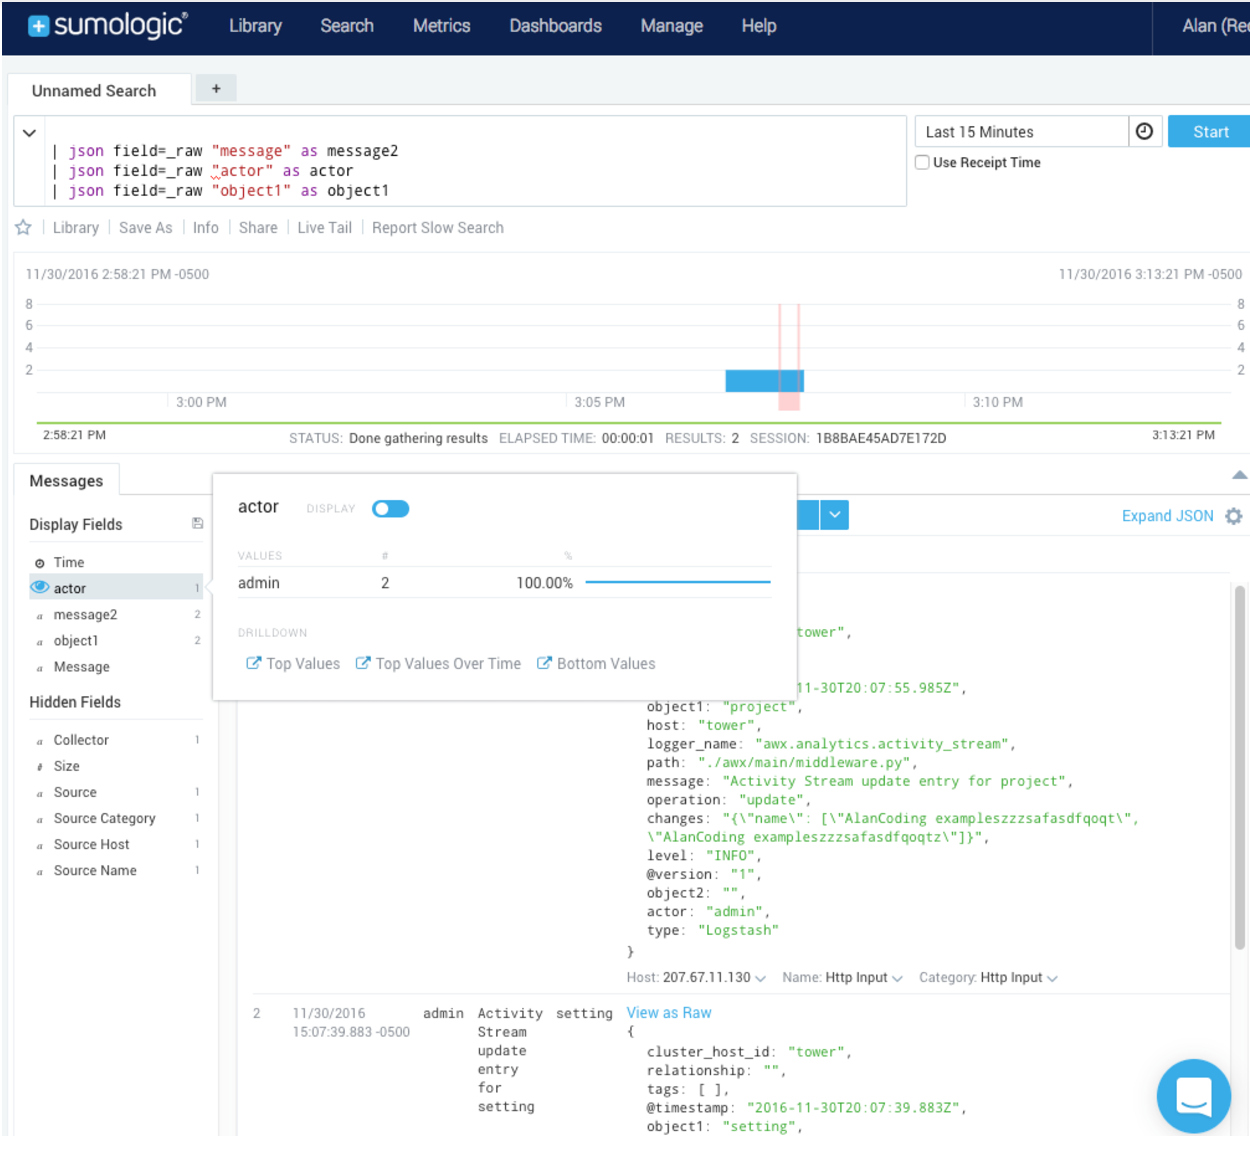
8.3. Sumologic
In Sumologic, create a search criteria containing the json files that provide the parameters used to collect the data you need.
8.4. Elastic stack (formerly ELK stack)
You can visualize information from the Tower logs in Kibana, captured via an Elastic stack consuming the logs. Ansible Tower provides compatibility with the logstash connector, and compatibility with the data model of elastic search. You can use the example settings, and either a library or provided examples to stand up containers that will demo the Elastic stack use end-to-end.
Tower uses logstash configuration to specify the source of the logs. Use this template to provide the input:
input {
   http {
        port => 8085
        user => logger_username
        password => "password"
   }
}
Add this to your configuration file in order to process the message content:
filter {
   json {
        source => "message"
   }
}