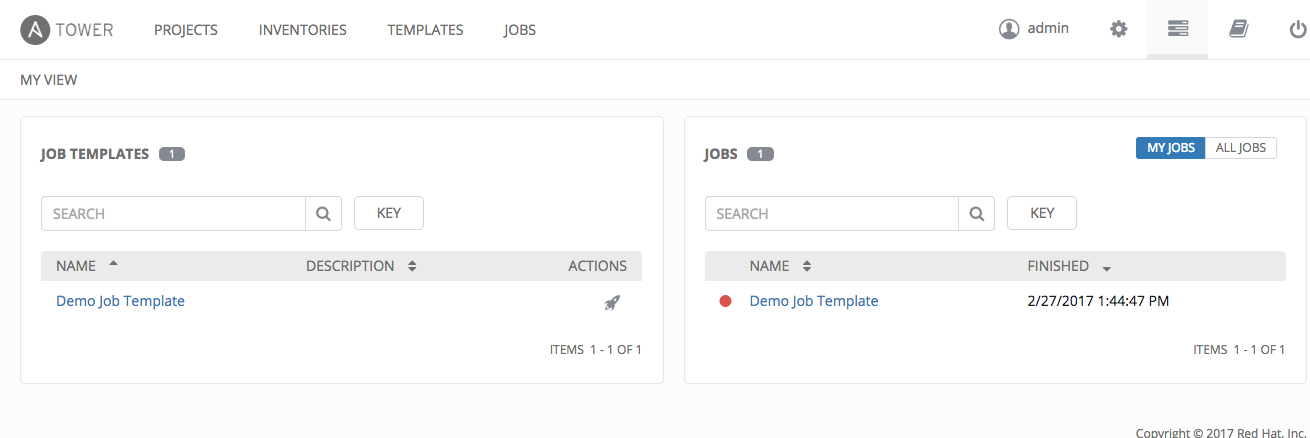
5. The Tower Dashboard and Interface
Note
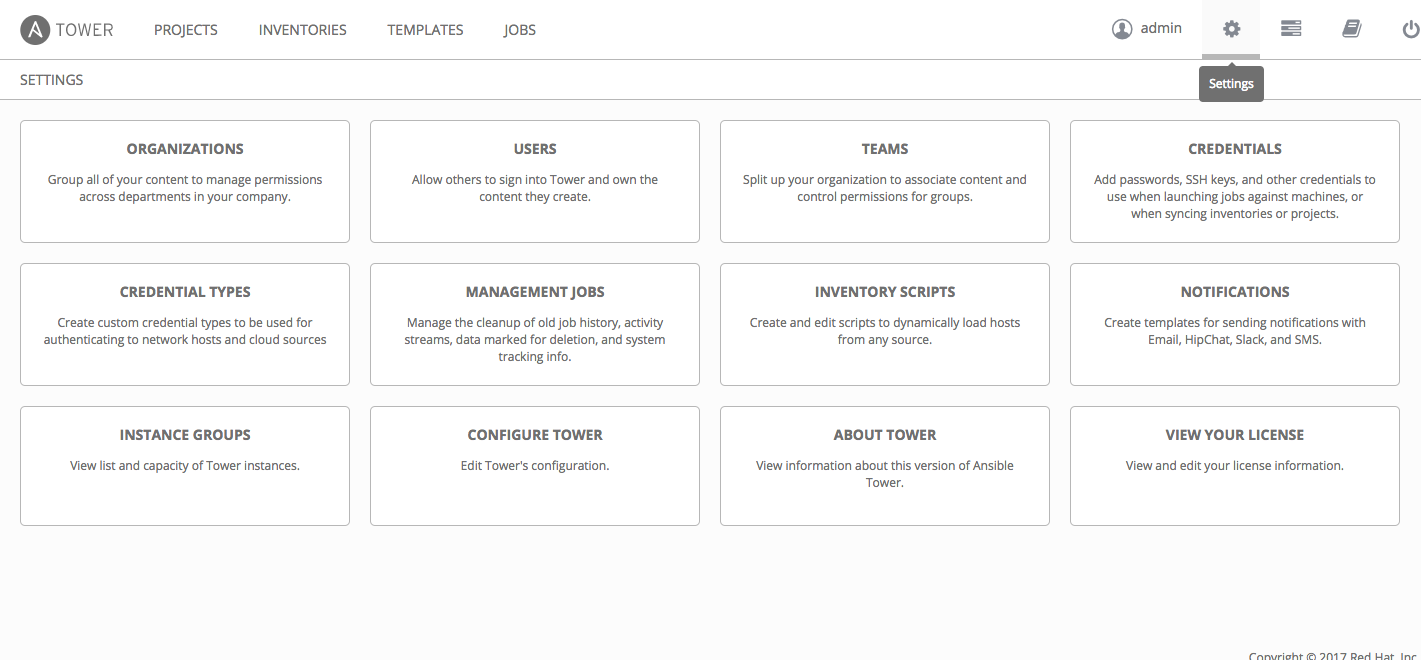
Ansible Tower 3.0 provides a streamlined interface, with the Settings ( ) button offering access to administrative configuration options. Users of older versions of Ansible Tower (2.4.5 or older) can access most of these through the top-level navigational menu or from their “Setup” menu button.
The Tower Dashboard offers a friendly graphical framework for your IT orchestration needs. Across the top-left side of the Tower Dashboard, administrators can quickly navigate to their Projects, Inventories, Job Templates, and Jobs.
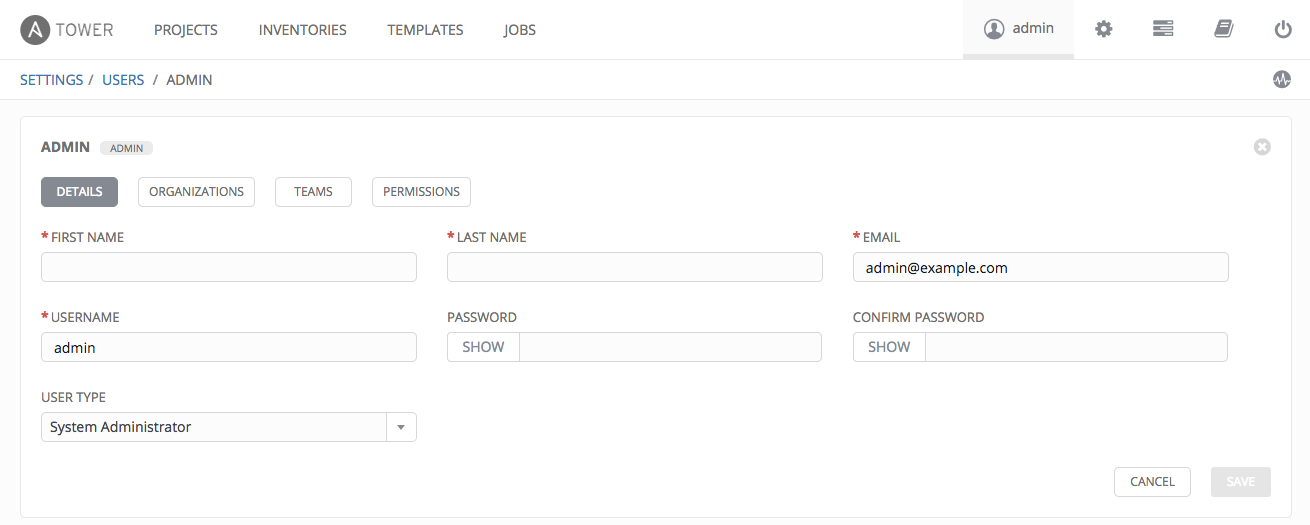
Across the top-right side of this interface, administrators can access the tools they need to configure organizations, users, groups, and permissions as well as view related documentation, access portal mode, and log out.

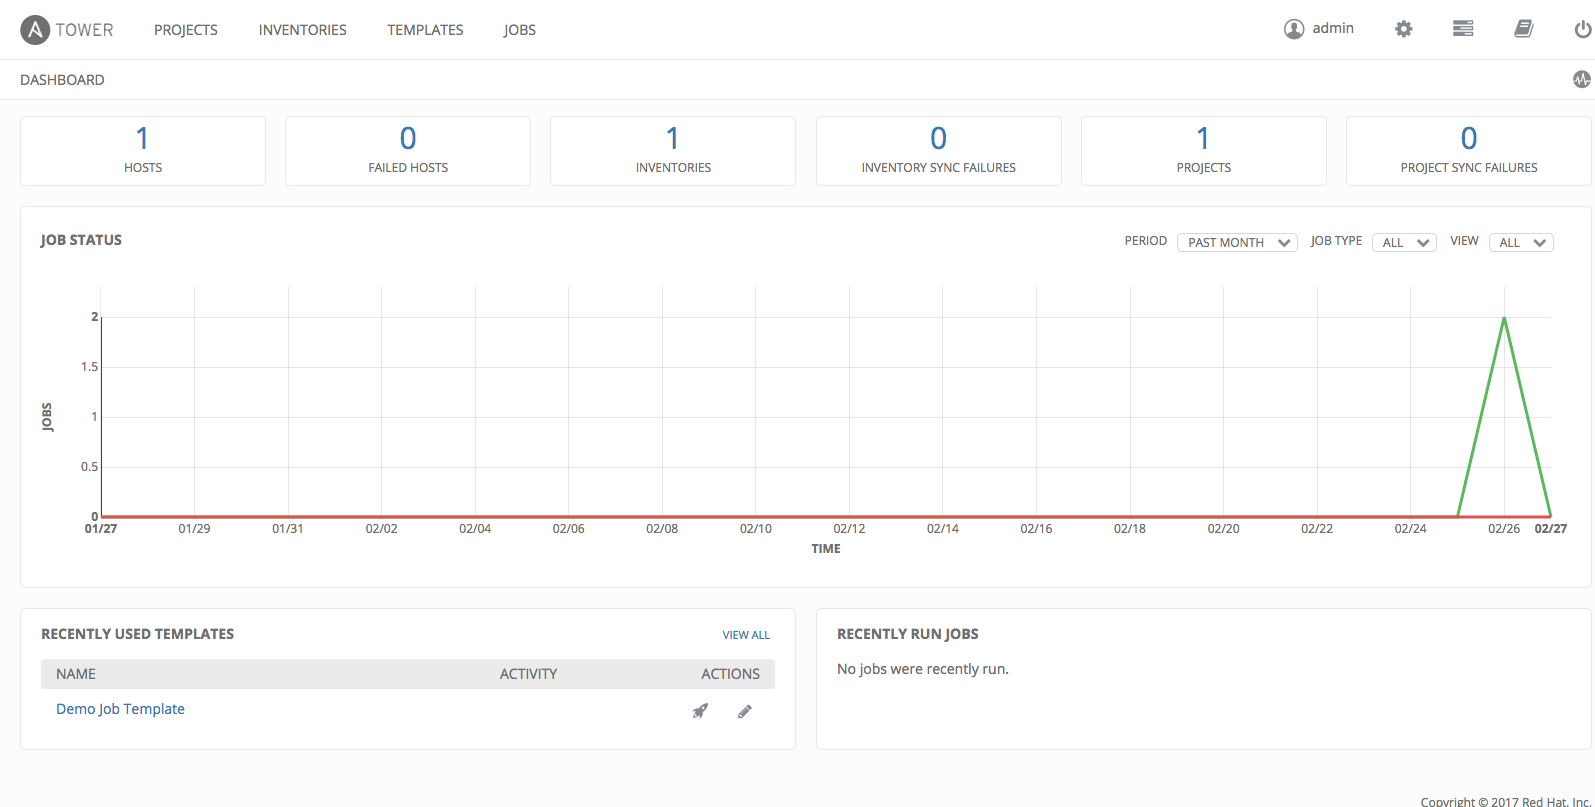
At the top of the Dashboard is a summary of your hosts, inventories, and projects. Each of these is linked to the corresponding object in Tower, for easy access.

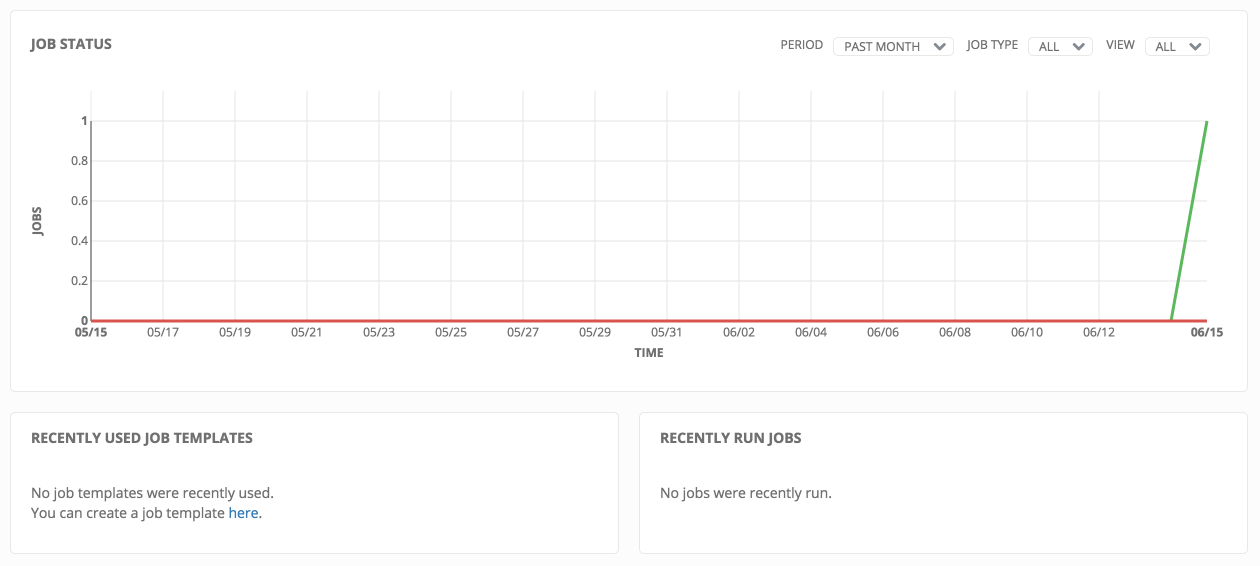
On the main Tower Dashboard screen, a summary appears listing your current Job Status. Also available for review are summaries of Recently Used Job Templates and Recently Run Jobs.
Note
Clicking on the Ansible Tower logo at any time returns you to the Dashboard.
5.4. Dashboard Views
The central interface to Tower is the Dashboard. You will use the dashboard to quickly view job statuses, recently run jobs, and recently used job templates.
5.4.1. Job Status
The Job Status graph displays the number of successful and failed jobs over a specified time period. You can choose to limit the job types that are viewed, and to change the time horizon of the graph.
5.4.2. Recently Used Job Templates
The Jobs section of this display shows a summary of the most recently used jobs. You can also access this summary by clicking on the Jobs entry in the main navigation menu.
5.4.3. Recently Run Jobs
The Recently Run Jobs section displays which jobs were most recently run, their status, and notes when they were run as well.
5.5. Activity Streams
Most screens in Tower have an Activity Stream ( ) button. Clicking this brings up the
Activity Stream for this object.
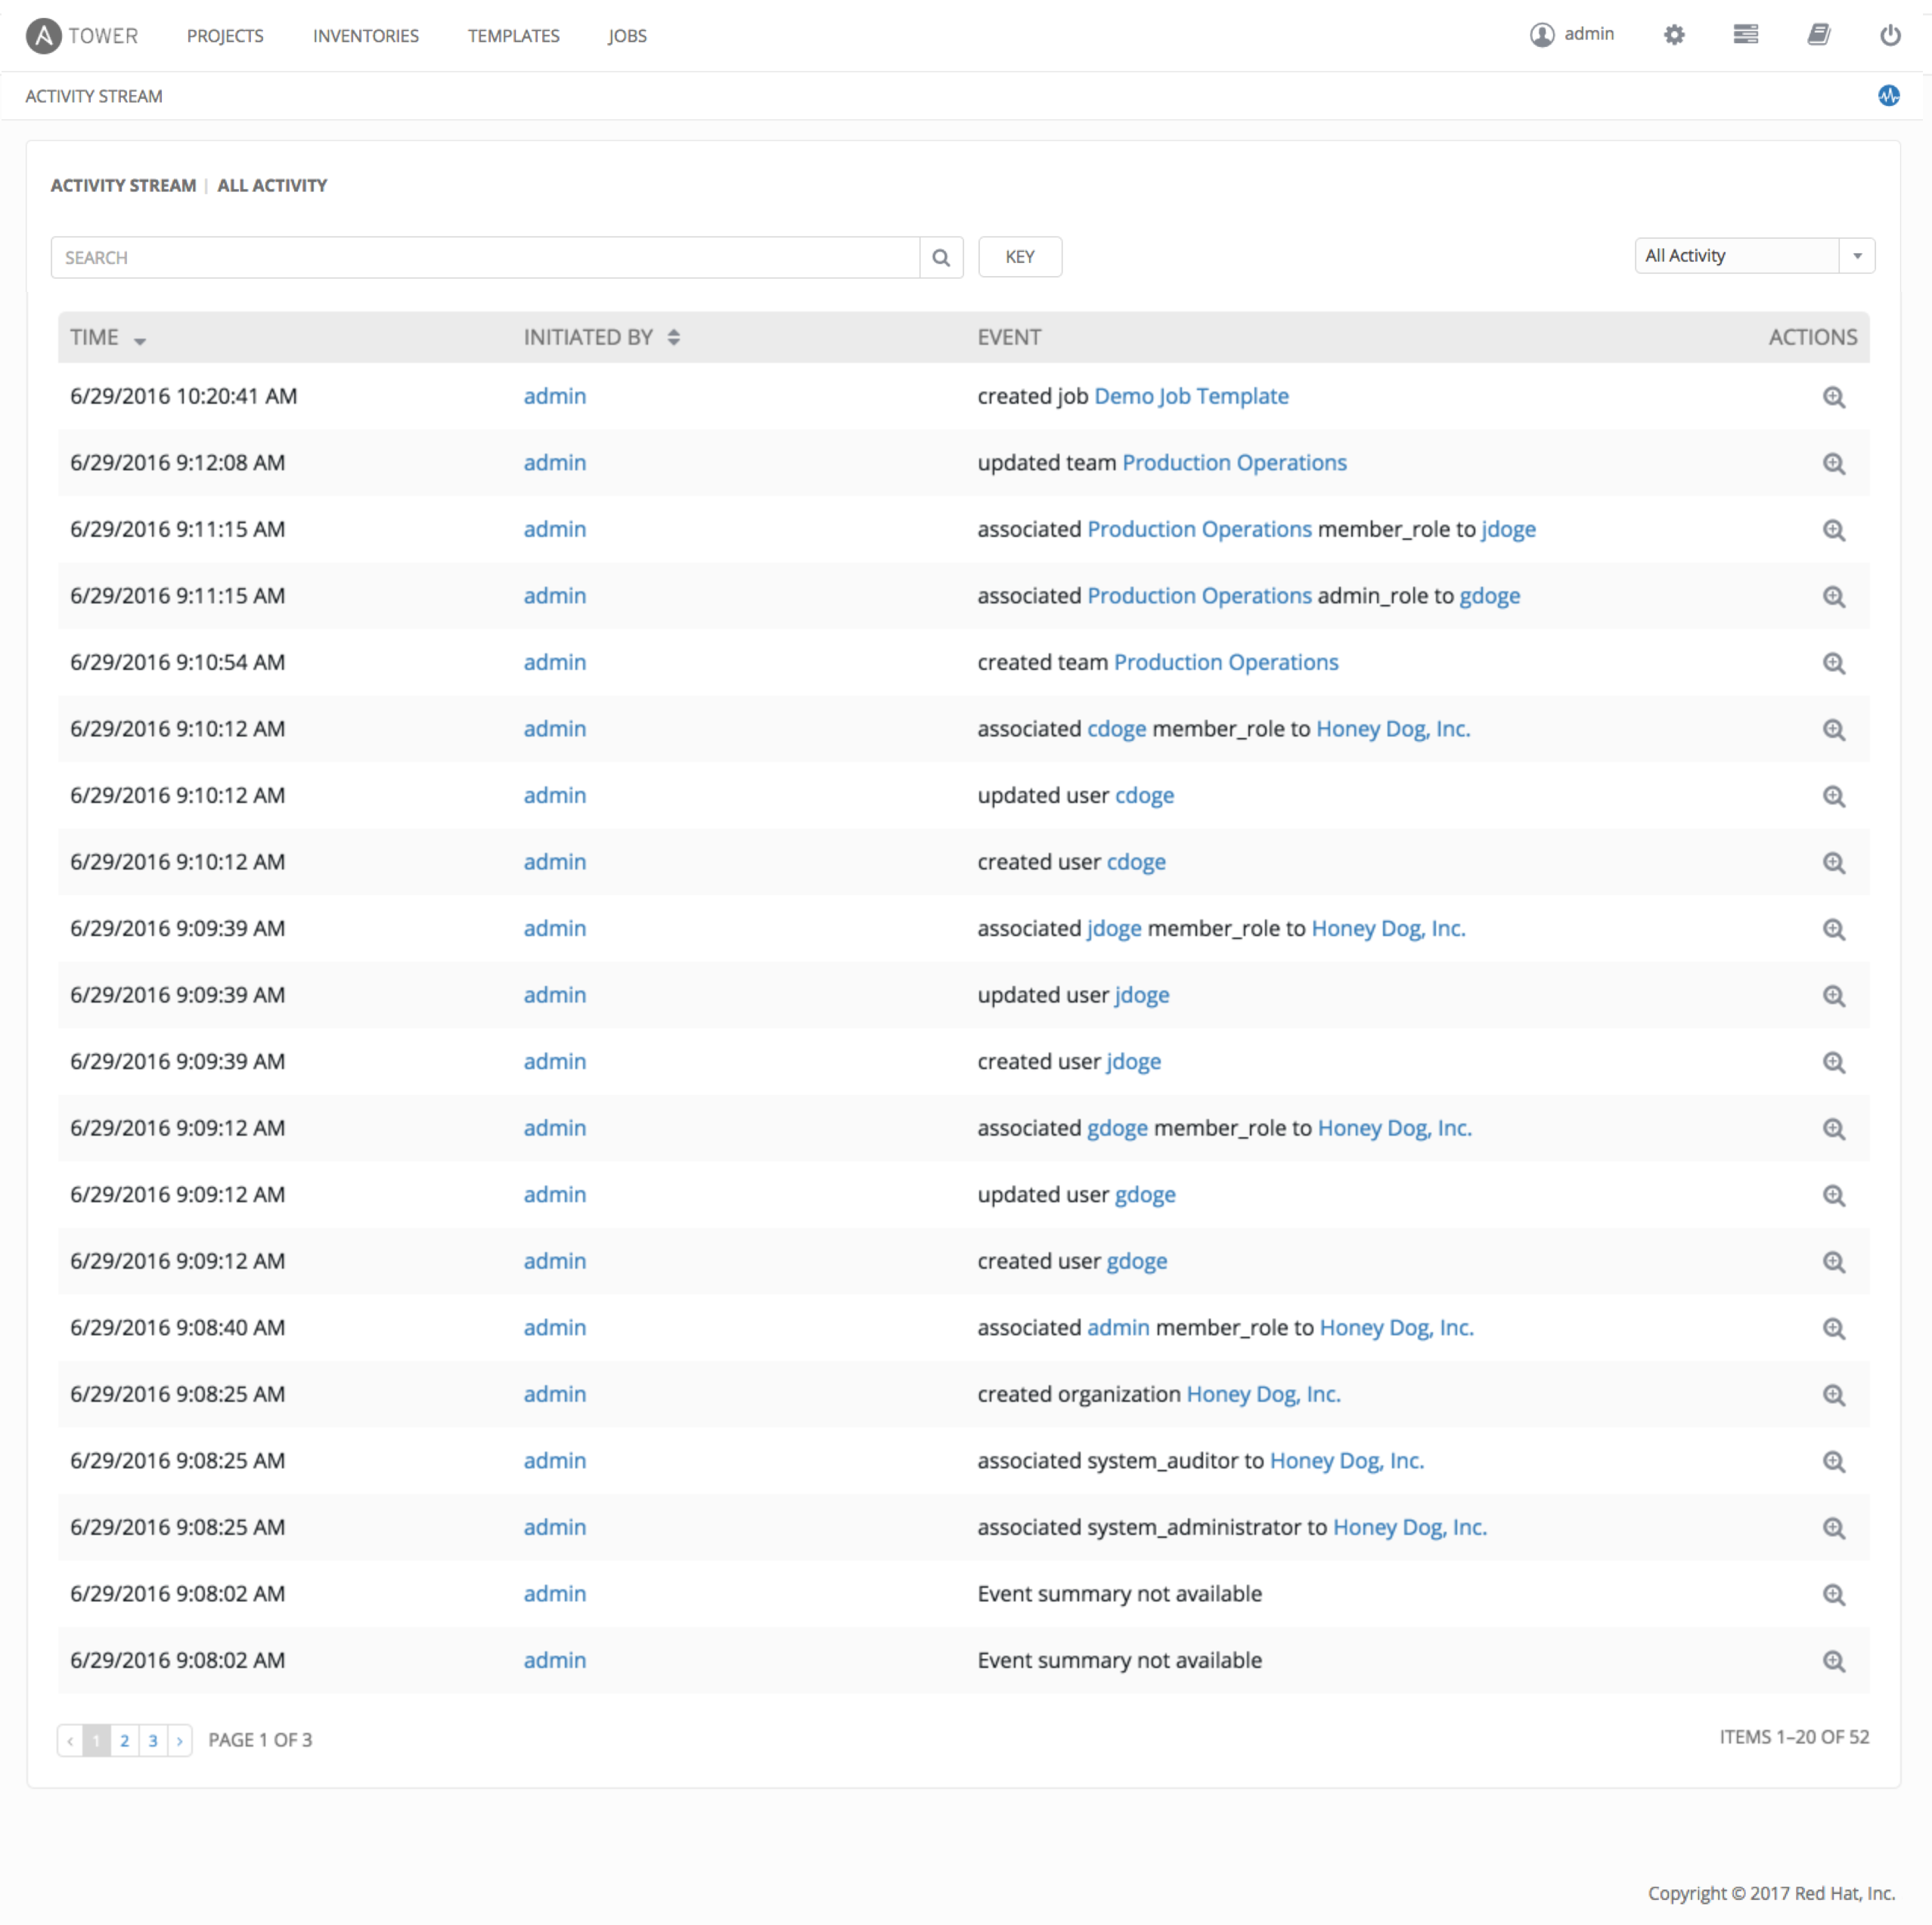
An Activity Stream shows all changes for a particular object. For each
change, the Activity Stream shows the time of the event, the user that
initiated the event, and the action. Clicking on the Examine ( ) button shows the
event log for the change.
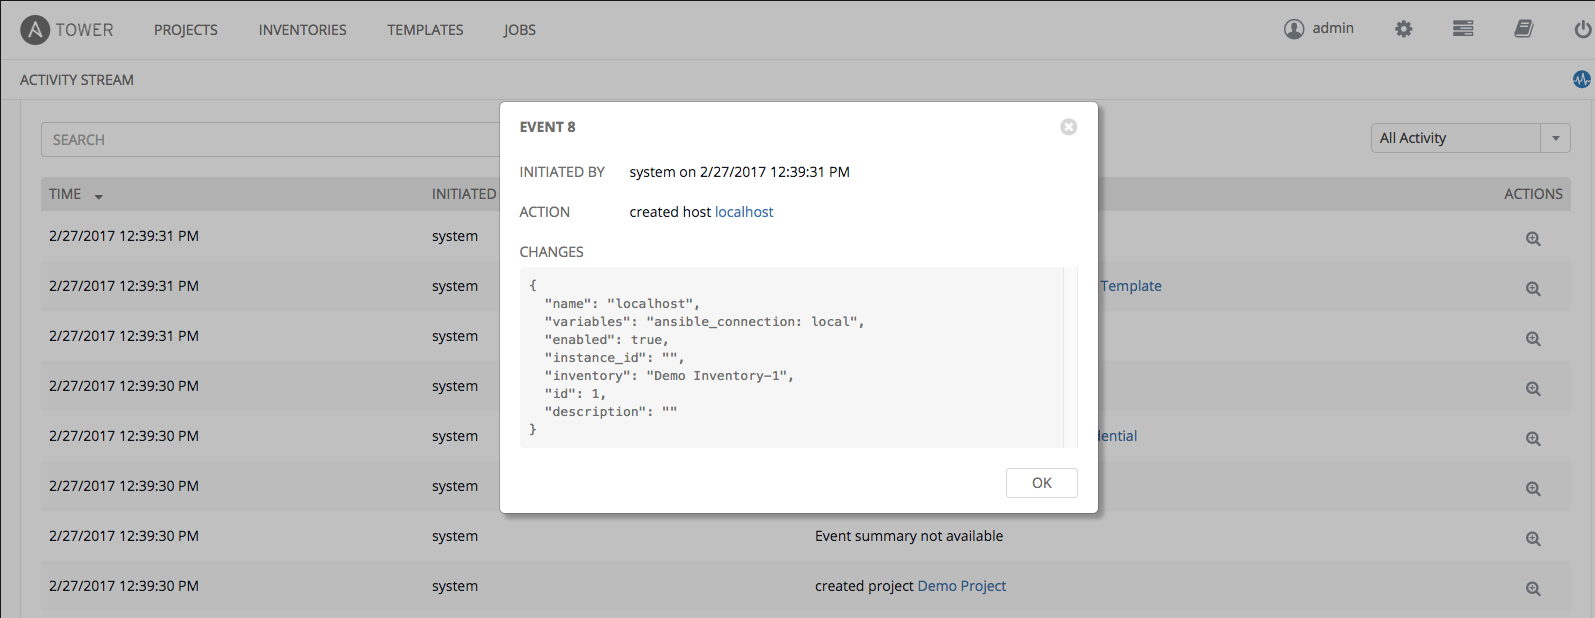
The Activity Stream can be filtered by the initiating user (or the system, if it was system initiated), and by any related Tower object, such as a particular credential, job template, or schedule.
The Activity Stream on the main Dashboard shows the Activity Stream for the entire Tower instance. Most pages in Tower allow viewing an activity stream filtered for that specific object.
 .
.
 ) button.
 button beside a job in My View launches it, potentially asking some survey questions if the job is configured to do so.