11. Tower Logging and Aggregation
Logging is a standalone feature introduced in Ansible Tower 3.1.0 that provides the capability to send detailed logs to several kinds of 3rd party external log aggregation services. Services connected to this data feed serve as a useful means in gaining insight into Tower usage or technical trends. The data can be used to analyze events in the infrastructure, monitor for anomalies, and correlate events from one service with events in another. The types of data that are most useful to Tower are job fact data, job events/job runs, activity stream data, and log messages. The data is sent in JSON format over a HTTP connection using minimal service-specific tweaks engineered in a custom handler or via an imported library. Tower discards any uncaptured data if the logging aggregator is down.
11.1. Loggers
Below are special loggers (except for awx, which constitutes generic server logs) that provide large amount of information in a predictable structured or semi-structured format, following the same structure as one would expect if obtaining the data from the API:
job_status: Summarizes status changes for jobs, project updates, inventory updates, and othersjob_events: Provides data returned from the Ansible callback moduleactivity_stream: Displays the record of changes to the objects within the Ansible Tower applicationsystem_tracking: Provides data gathered by Ansible scan modules ran by scan job templatesawx: Provides generic server logs, which include logs that would normally be written to a file. It contains the standard metadata that all logs have, except it only has the message from the log statement.
These loggers only use log-level of INFO, except for the awx logger, which may be any given level.
Additionally, the standard Tower logs are be deliverable through this same mechanism. It is apparent how to enable or disable each of these five sources of data without manipulating a complex dictionary in your local settings file, as well as adjust the log-level consumed from the standard Tower logs.
11.1.1. Log message schema
Common schema for all loggers:
cluster_host_id: Unique identifier of the host within the Tower clusterlevel: Standard python log level, roughly reflecting the significance of the event All of the data loggers as a part of this feature use INFO level, but the other Tower logs will use different levels as appropriatelogger_name: Name of the logger we use in the settings, for example, “activity_stream”@timestamp: Time of logpath: File path in code where the log was generated
11.1.2. Activity stream schema
(common): This uses all the fields common to all loggers listed above
actor: Username of the user who took the action documented in the logchanges: JSON summary of what fields changed, and their old/new values.operation: The basic category of the changed logged in the activity stream, for instance, “associate”.object1: Information about the primary object being operated on, consistent with what we show in the activity streamobject2: If applicable, the second object involved in the action
11.1.3. Job event schema
This logger reflects the data being saved into job events, except when they would otherwise conflict with expected standard fields from the logger, in which case the fields are nested. Notably, the field host on the job_event model is given as event_host. There is also a sub-dictionary field, event_data within the payload, which contains different fields depending on the specifics of the Ansible event.
This logger also includes the common fields.
11.1.4. Scan / fact / system tracking data schema
These contain a detailed dictionary-type fields that are either services, packages, or files.
(common): This uses all the fields common to all loggers listed above
services: For services scans, this field is included and has keys based on the name of the service. NOTE: Periods are disallowed by elastic search in names, and are replaced with “_” by our log formatterpackage: Included for log messages from package scansfiles: Included for log messages from file scanshost: Name of host scan applies toinventory_id: Inventory id host is inside of
11.1.5. Job status changes
This is a intended to be a lower-volume source of information about changes in job states compared to job events, and also intended to capture changes to types of unified jobs other than job template based jobs.
In addition to common fields, these logs include fields present on the job model.
11.1.6. Tower logs
In addition to the common fields, this contains a msg field with the log message. Errors contain a separate traceback field. These logs can be enabled or disabled in the Configure Tower User Interface ENABLE EXTERNAL LOGGING setting.
11.1.7. Logging Aggregator Services
The logging aggregator service works with the following monitoring and data analysis systems:
11.1.7.1. Splunk
Ansible Tower’s Splunk logging integration uses the Splunk HTTP Collector. When configuring a SPLUNK logging aggregator, add the full URL to the HTTP Event Collector host, like in the following example:
https://yourtowerfqdn.com/api/v2/settings/logging

{
    "LOG_AGGREGATOR_HOST": "https://yoursplunk:8088/services/collector/event",
    "LOG_AGGREGATOR_PORT": null,
    "LOG_AGGREGATOR_TYPE": "splunk",
    "LOG_AGGREGATOR_USERNAME": "",
    "LOG_AGGREGATOR_PASSWORD": "$encrypted$",
    "LOG_AGGREGATOR_LOGGERS": [
        "awx",
        "activity_stream",
        "job_events",
        "system_tracking"
    ],
    "LOG_AGGREGATOR_INDIVIDUAL_FACTS": false,
    "LOG_AGGREGATOR_ENABLED": true,
    "LOG_AGGREGATOR_TOWER_UUID": ""
}
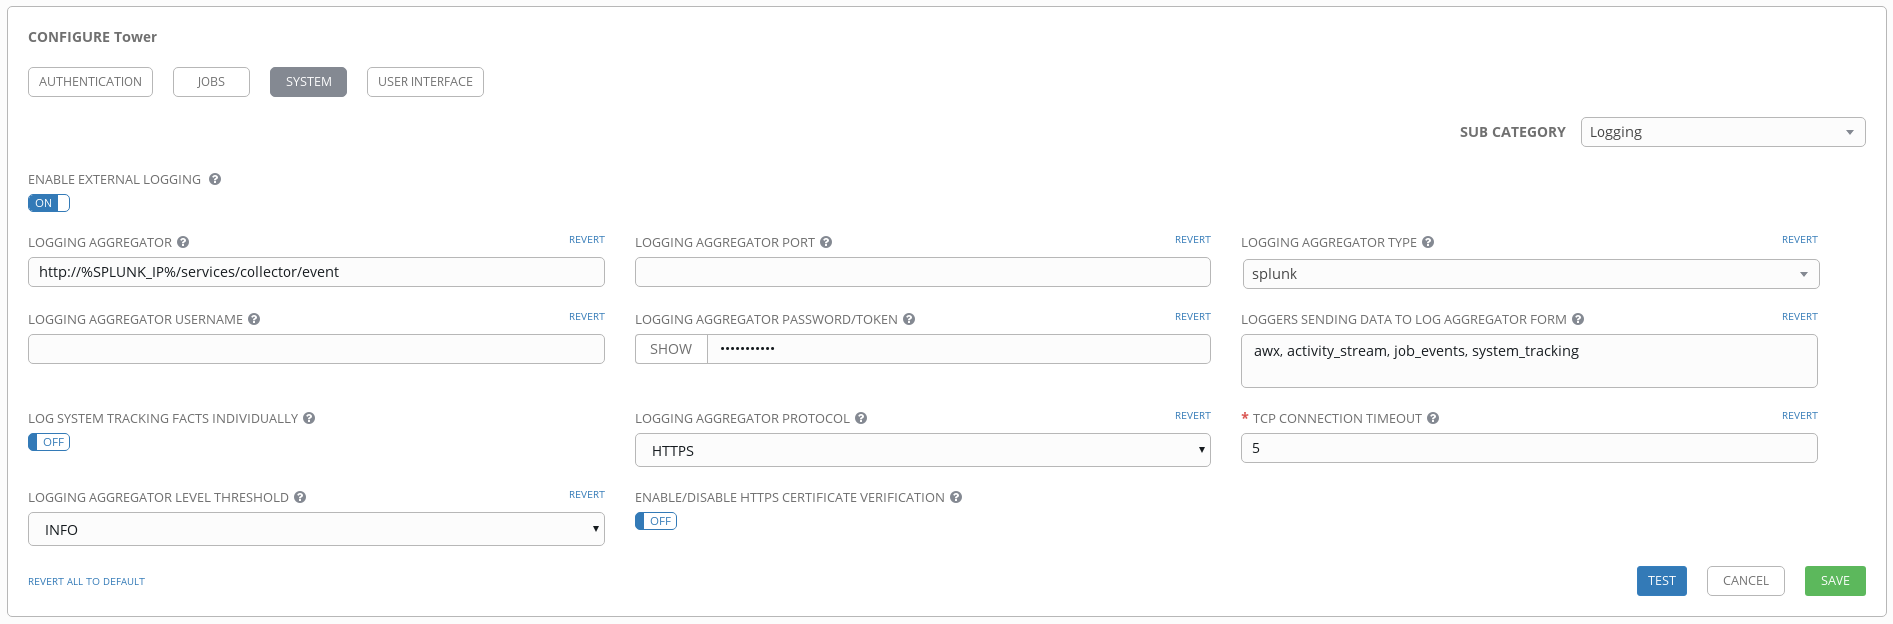
Splunk HTTP Event Collector listens on 8088 by default so it is necessary to provide the full HEC event URL (with port) in order for incoming requests to be processed successfully. These values are entered in the example below:
For further instructions on configuring the HTTP Event Collector, refer to the Splunk documentation.
11.1.7.2. Loggly
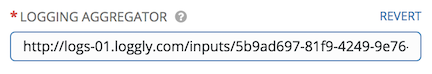
To set up the sending of logs through Loggly’s HTTP endpoint, refer to https://www.loggly.com/docs/http-endpoint/. Loggly uses the URL convention described at http://logs-01.loggly.com/inputs/TOKEN/tag/http/, which is shown inputted in the Logging Aggregator field in the example below:
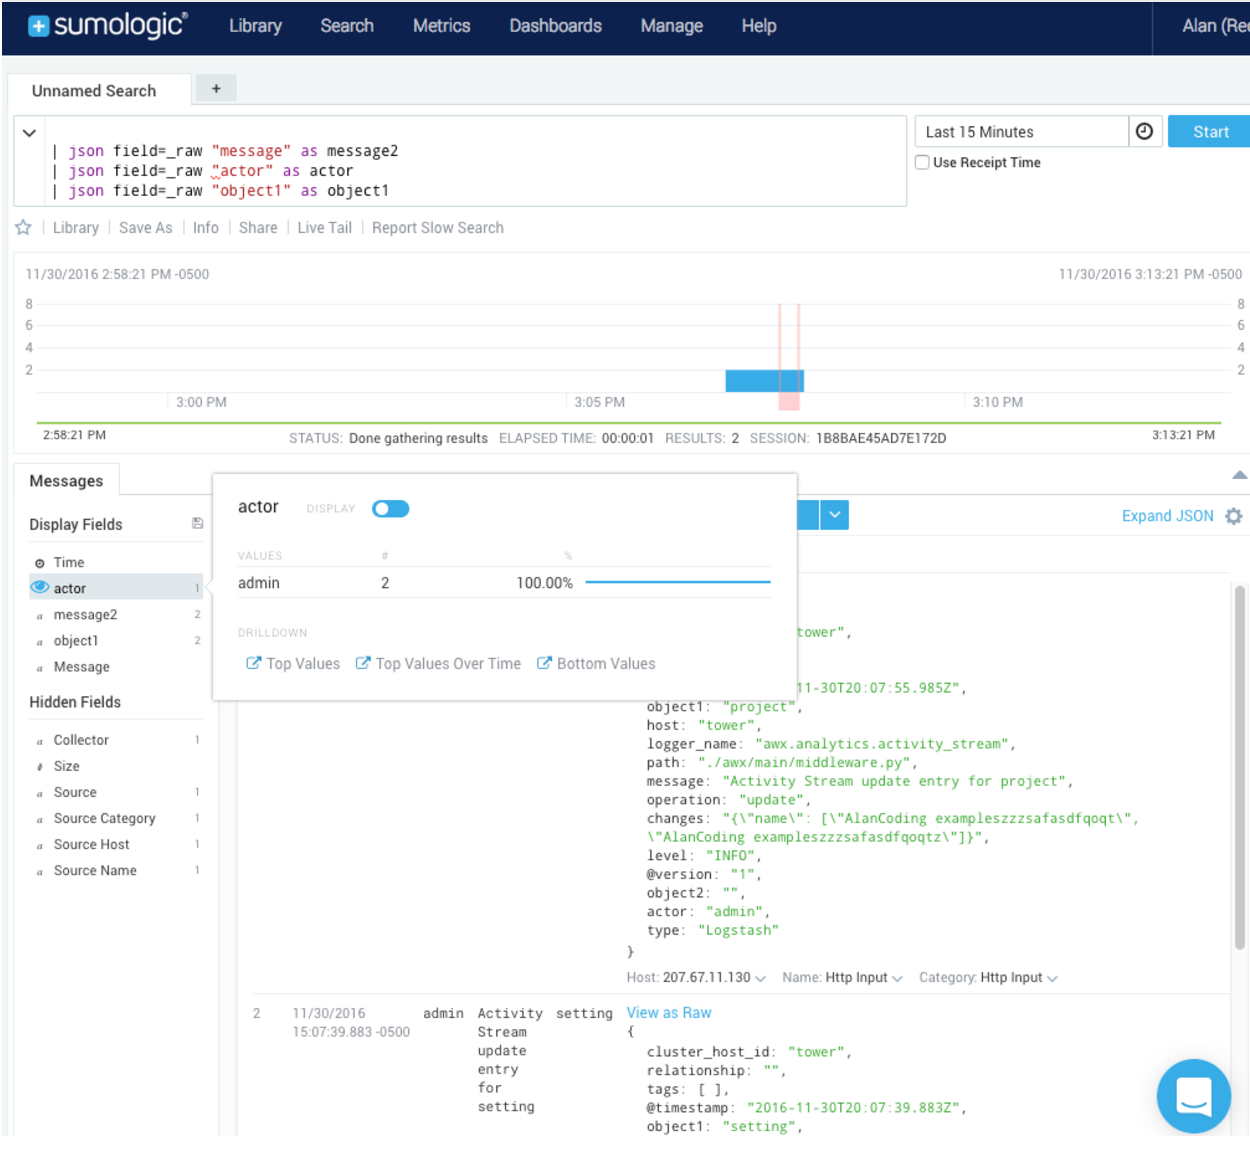
11.1.7.3. Sumologic
In Sumologic, create a search criteria containing the json files that provide the parameters used to collect the data you need.
11.1.7.4. Elastic stack (formerly ELK stack)
If starting from scratch, standing up your own version the elastic stack, the only change you required is to add the following lines to the logstash logstash.conf file:
filter {
  json {
    source => "message"
  }
}
Note
Backward-incompatible changes were introduced with Elastic 5.0.0, and different configurations may be required depending on what versions you are using.
11.2. Set Up Logging with Tower
To set up logging to any of the aggregator types:
Click the Settings (
 ) icon from the left navigation bar.
Select the System tab.
Select Logging from the Sub Category drop-down menu list.
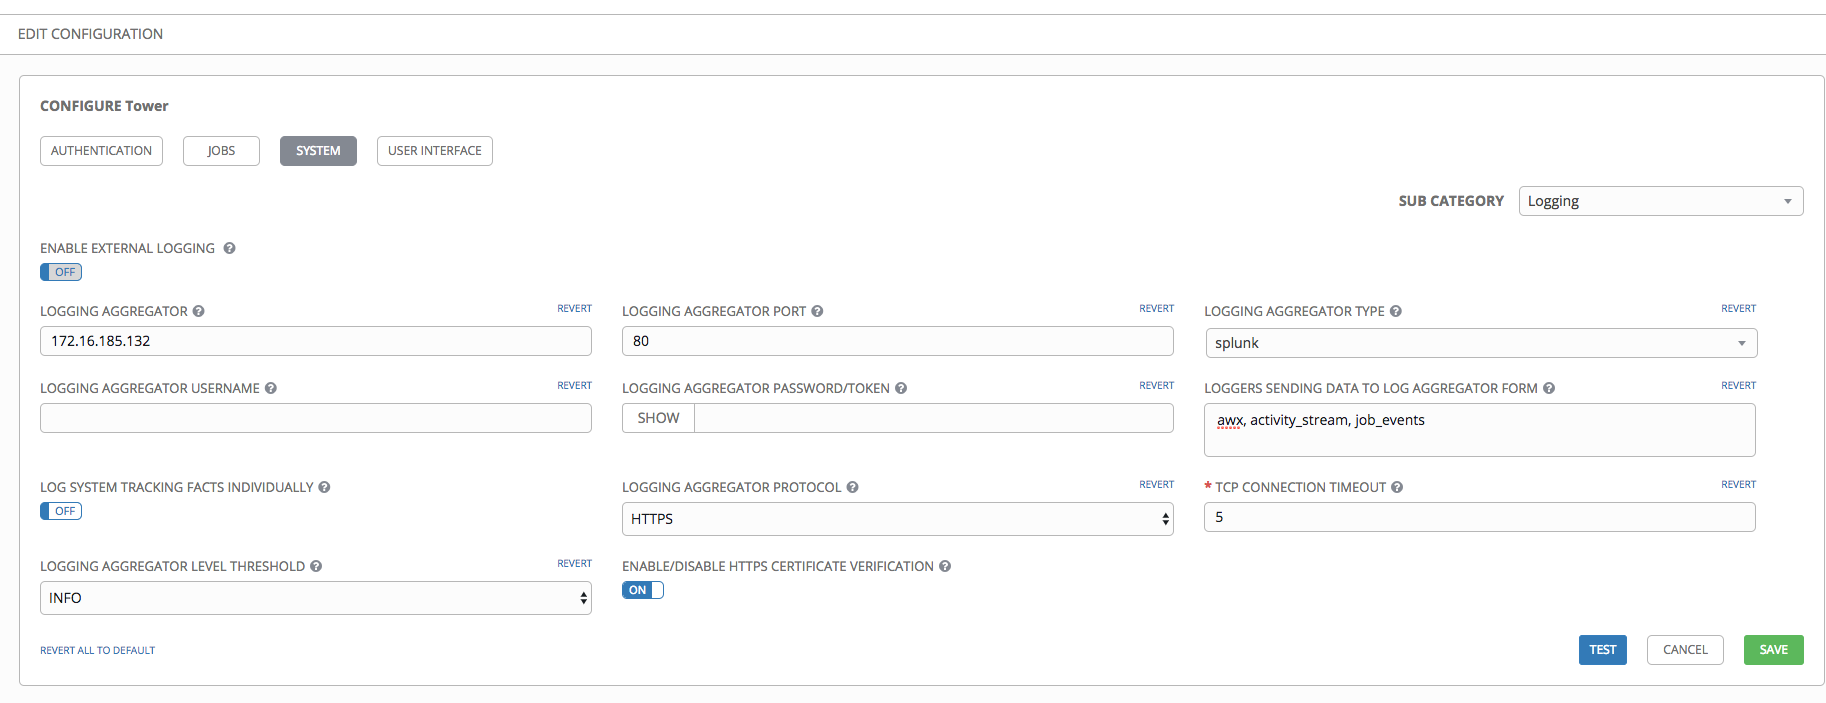
Set the configurable options from the fields provided:
Enable External Logging: Click the toggle button to ON if you want to send logs to an external log aggregator.
Logging Aggregator: Enter the hostname or IP address you want to send logs.
Logging Aggregator Port: Specify the port for the aggregator if it requires one.
Note
When the connection type is HTTPS, you can enter the hostname as a URL with a port number and therefore, you are not required to enter the port again. But TCP and UDP connections are determined by the hostname and port number combination, rather than URL. So in the case of TCP/UDP connection, supply the port in the specified field. If instead a URL is entered in host field (Logging Aggregator field), its hostname portion will be extracted as the actual hostname.
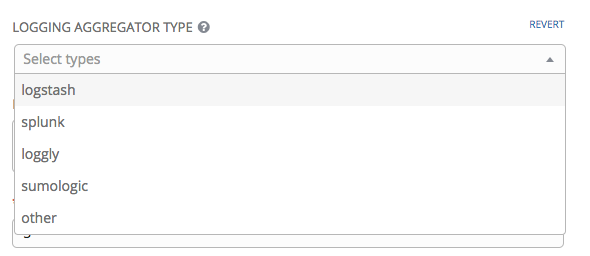
Logging Aggregator Type: Click to select the aggregator service from the drop-down menu:
Logging Aggregator Username: Enter the username of the logging aggregator if it requires it.
Logging Aggregator Password/Token: Enter the password of the logging aggregator if it requires it.
Loggers to Send Data to the Log Aggregator Form: All four types of data are pre-populated by default. Click the tooltip
 icon next to the field for additional information on each data type. Delete the data types you do not want.
Log System Tracking Facts Individually: Click the tooltip
icon for additional information whether or not you want to turn it on, or leave it off by default.Logging Aggregator Protocol: Click to select a connection type (protocol) to communicate with the log aggregator. Subsequent options vary depending on the selected protocol.
TCP Connection Timeout: Specify the connection timeout in seconds. This option is only applicable to HTTPS and TCP log aggregator protocols.
Logging Aggeregator Level Threshold: Select the level of severity you want the log handler to report.
Enable/Disable HTTPS Certificate Verification: Certificate verification is enabled by default for HTTPS log protocol. Click the toggle button to OFF if you do not want the log handler to verify the HTTPS certificate sent by the external log aggregator before establishing a connection.
Review your entries for your chosen logging aggregation. Below is an example of one set up for Splunk:
To verify if your configuration is set up correctly, click Test. This verifies the logging configuration by sending a test log message and checking the response code is OK.
When done, click Save to apply the settings or Cancel to abandon the changes.